Trying to understand the performance of certain types of investments can be very frustrating, especially when you're talking about relatively steady investments like bonds. The market segmentation theory attempts to answer questions about bond performance and has wide-ranging applications.
Definition
What is market segmentation theory?
The market segmentation theory states there's no direct relationship between the interest rates for bonds with different maturity lengths. In other words, the interest rates for short-term bonds and long-term bonds are set independently of each other, based on the market demand for each within their own segment.
It makes sense if you think about it. If someone is looking for a long-term investment vs. a short-term one, they're looking for entirely different things and assessing the investment differently. Your one-year bond doesn't need to return nearly as well as a 10-year bond, for example, because you don't have to calculate things like long-term future inflation to determine when you jump into that investment.
The flip side to that, of course, is that different types of investors invest in different types of bonds. The one looking for a long-term bond is very different from the one who is looking for a short-term bond and has different reasons for doing so. Another related theory, called the preferred habitat theory, states that investors tend to basically stay within the same type of bond investment unless they can be guaranteed higher yields, even when the risk is equal.
Segmented markets vs. term structure
Segmented markets vs. term structure
The segmented markets theory was introduced by American economist John Mathew Culbertson in a 1957 paper called The Term Structure of Interest Rates. In this paper, which is basically arguing against the idea of term structure, Culbertson argues against Irving Fisher's idea of term structure -- essentially the opposite of the segmented markets theory.
In the term structure of interest rates theory, bond interest rates are related to each other, even if it's not a terribly obvious relationship. The theory is still widely used to help understand how the economy is performing and may perform in the future.
Yield curve
How does the yield curve fit into this?
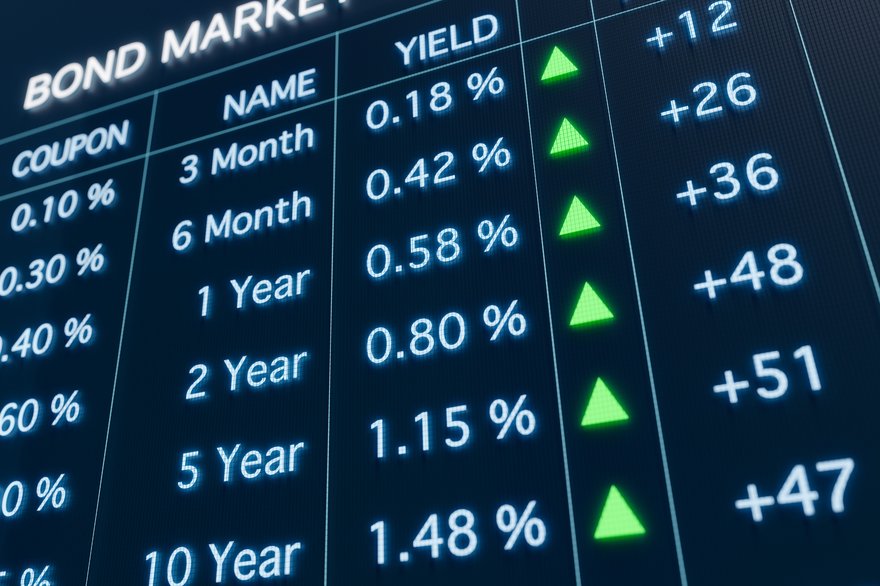
The yield curve comes from plotting the differences between yields for both short-term and long-term bonds. It typically compares the yields of bonds with equal credit ratings but different maturity dates, including three-month, two-year, five-year, and 30-year U.S. Treasury bonds.
Based on the shape of the yield curve, economists can make several assumptions about the current economy and even potentially predict what it may do in the near future, using various bond interest rate theories, including the market segmentation theory.
Related investing topics
Yield curve interpretations
Different yield curves and interpretations
There are five basic types of yield curves: normal, steep, inverted, humped, and flat. They each mean different things in relation to bond yields, and some show strong correlations to economic conditions.
- Normal yield curves have a positive slope and indicate that longer-term bonds have higher yields than shorter-term bonds. This is considered "normal" because the risk is greater for longer-term bonds, so it would make sense that these would offer more interest.
- Steep yield curves are a variation of a normal yield curve, except that the rise in the interest rate for long-term bonds is much faster than that of shorter-term bonds.
- Inverted yield curves occur when short-term bond rates are higher than long-term bond yields. This is sometimes considered a short-term harbinger of poor economic conditions, such as a slowdown or recession.
- Humped yield curves are very uncommon but occur when medium-term bond rates are higher than those of both long- and short-term bonds. It can also point to a slowdown, although one that may be less imminent.
- Flat yield curves happen when all bonds, regardless of maturity length, have similar return rates. It's generally considered a sign of economic transition, to the positive or the negative. For example, you might see a flat yield curve when the economy is moving from recession into expansion or from expansion to recession.