Like other technical investing techniques, the moving average convergence or divergence (MACD) helps traders decide when to buy or sell stock based on its recent price action. This kind of investing differs from fundamental investing, which is focused on the performance of the business. In technical investing, traders buy and sell based on the movements in the stock and mostly ignore information on the business, such as earnings reports.

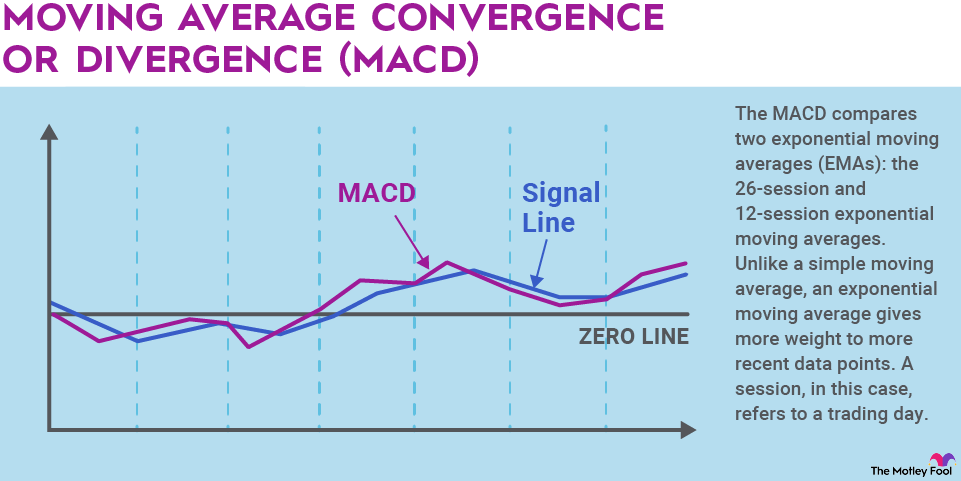
The MACD compares two exponential moving averages (EMAs): the 26-session and 12-session exponential moving averages. Unlike a simple moving average, an exponential moving average gives more weight to more recent data points. A session, in this case, refers to a trading day.
The MACD line is made by subtracting the 26-period EMA from the 12-period EMA, or the long-term line from the short-term one. Because the line is made by subtracting one moving average from another, it shows whether they are converging or diverging and adds weight to short-term movements.
How do you use the MACD?
Once you’ve determined the MACD, you can then take the nine-day EMA of the MACD line -- called the signal line -- and plot that on top of the MACD line as a guide to buy or sell a stock. When the MACD line crosses above the signal line, that’s a buy signal, showing the stock is rallying. When the MACD falls below the signal line, that should trigger a sell. Traders should also take into account how fast the charts are rising or falling, as well as divergences between the two lines since a large divergence could signal that a stock is overbought or oversold.
Investors can use any increment of time for the MACD, although the most common is 26/12/9 days. By tracking short-term movements this way, traders believe they can get a sense of whether a stock is oversold or overbought.
Does the MACD work?
The MACD is something of a one-size-fits-all indicator. Because it offers both leading and lagging indicators and a moving average trigger line, it’s responsive to short-term signals and makes it relatively easy to know when to buy or sell a stock, according to the indicator.
The nature of the strategy makes it easy for traders of all levels to use since it’s less complex than other technical indicators, and the chart is easy to read.
No technical tool is right all the time, and the MACD is best used in conjunction with other technical indicators and market trackers. The MACD is best known as a way to track trend reversals and can work well in directional markets. However, it tends to be unreliable when stocks are trading sideways or not trending in any particular direction.
Related investing topics
An example of the MACD
Let’s say you’re tracking the S&P 500, and you want to trade with a popular index fund like SPDR S&P 500 ETF. Say its 26-day exponential moving average is 400 and the 12-day exponential moving average is 395; you would have a MACD of -5.
A few days later, the 12-day EMA is higher than the 26-day one, giving you a MACD of 3. You would want to buy the stock when the MACD turned positive, which signals an entry point as the stock (or index fund, in this case) is moving higher. If the MACD stretched to 10, however, some traders might interpret that as a sign that the stock was oversold.
Technical indicators like the MACD can give traders further insight into the short-term direction of the market. Long-term investors trying to ride the next bull market are better off investing in fundamentally strong businesses, but understanding technical indicators like the MACD can help guide your decision-making and understand why the market moves the way it does.
You don’t have to trade with the MACD to use it. Following it for a few weeks might help you pick up on some other short-term trading insights.


