Loading paragraph...
Loading image...
Loading paragraph...
Loading paragraph...
Loading hub_pages...
Loading paragraph...
Loading image...
Loading paragraph...
Loading image...
Loading paragraph...
The Motley Fool has a disclosure policy.
Invest better with The Motley Fool. Get stock recommendations, portfolio guidance, and more from The Motley Fool's premium services.


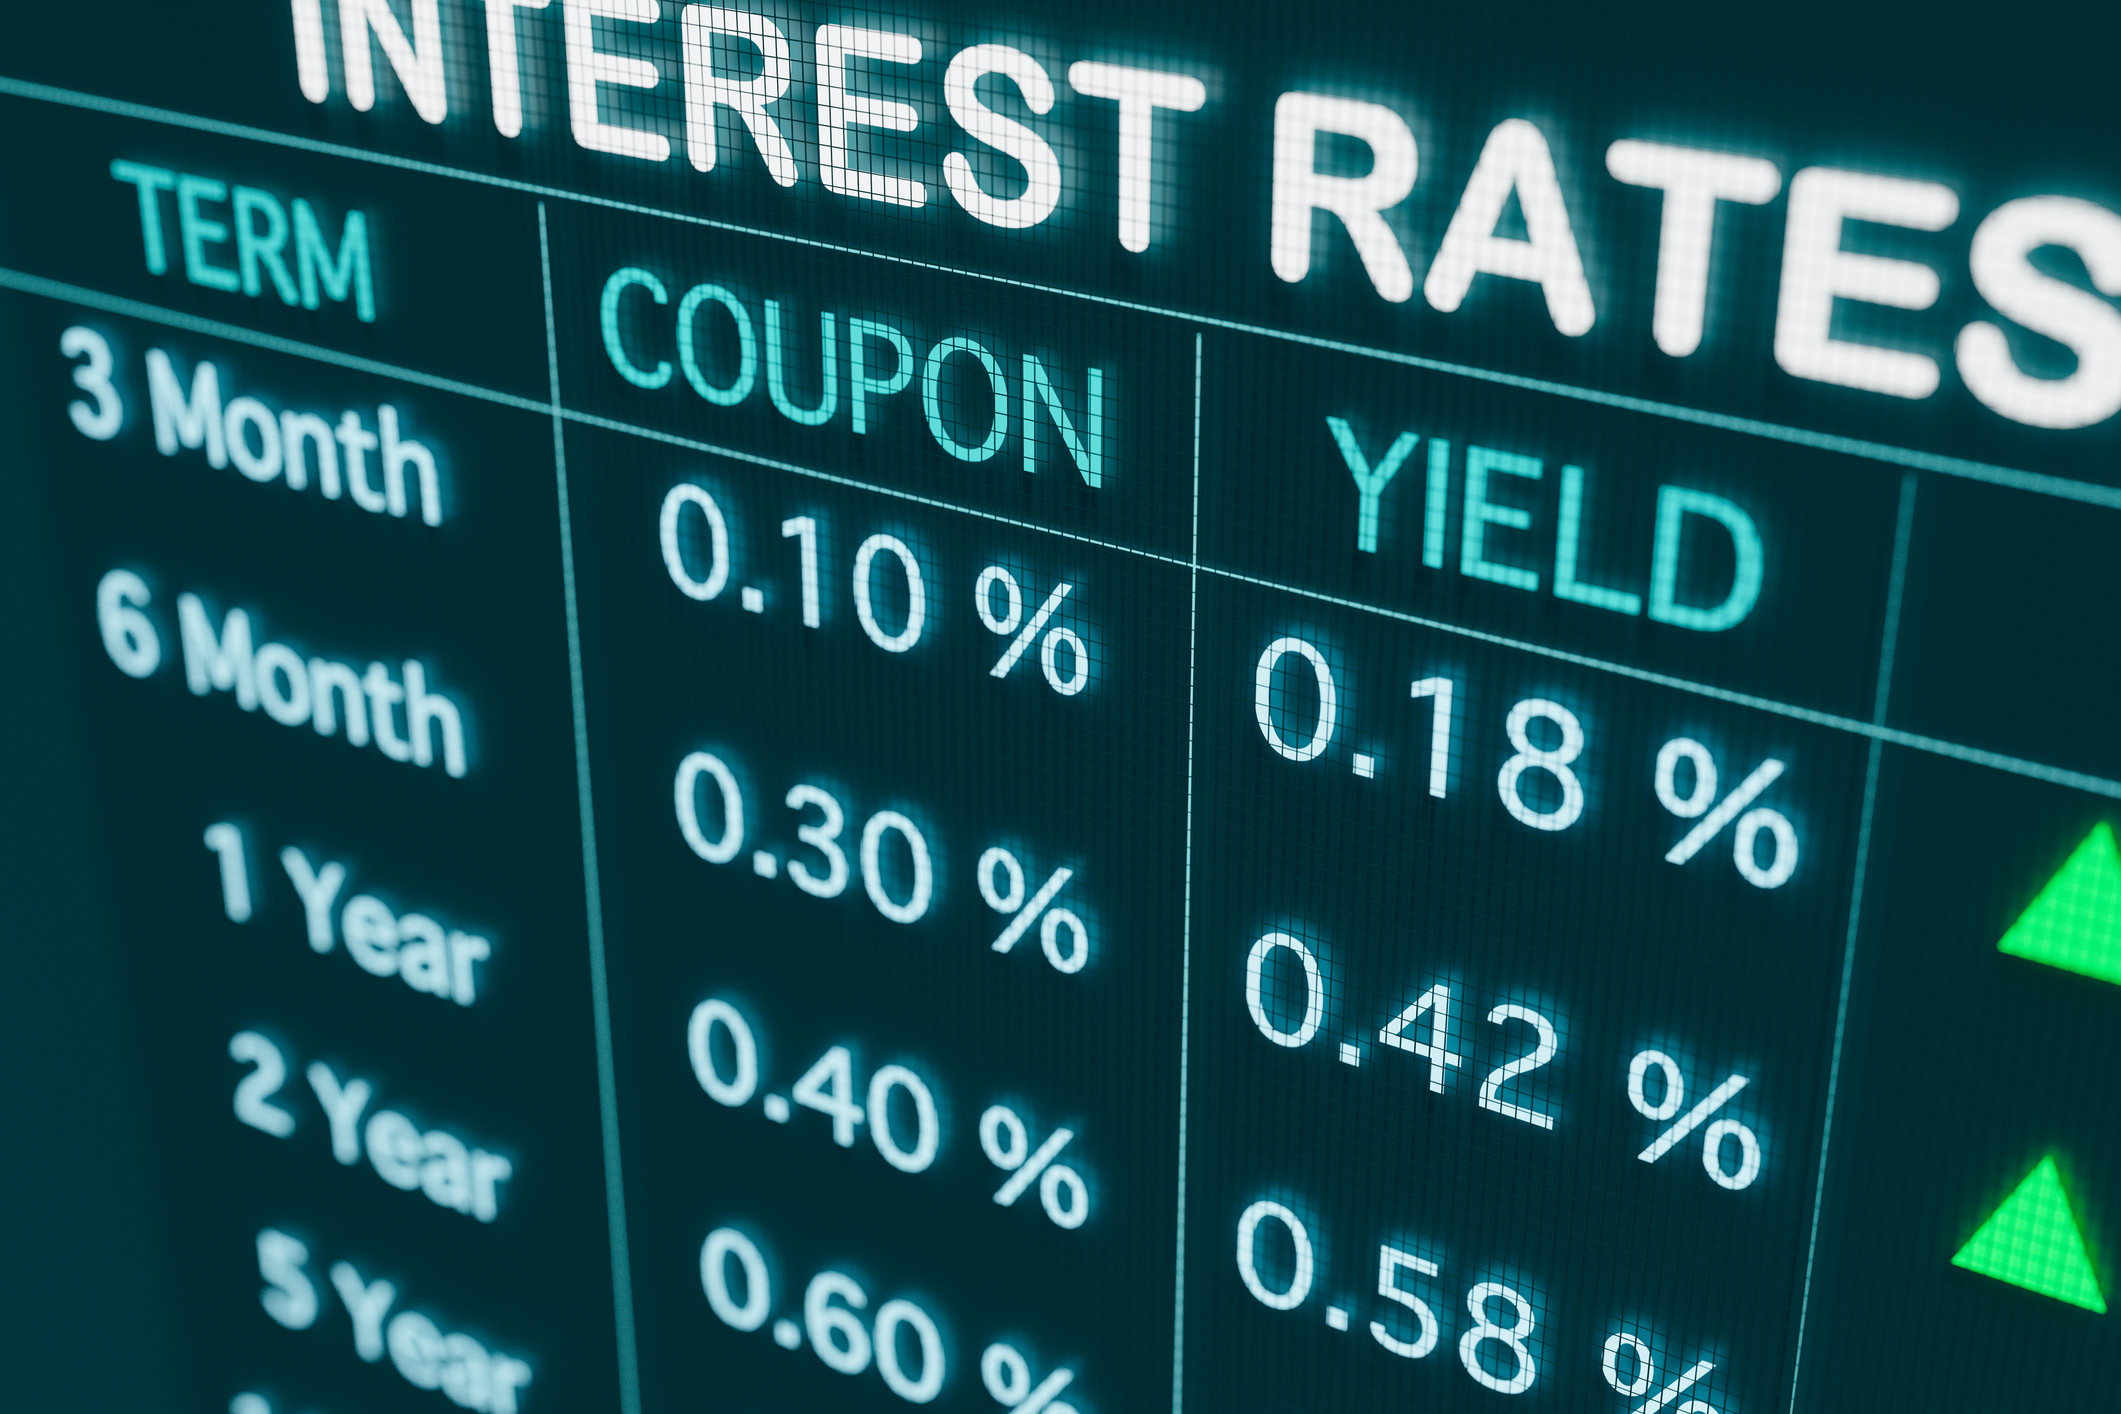
The yield curve is a line on a graph that typically shows the relationship between the yield that investors receive on a bond investment and the time until the bond matures. The borrowing period, or the time to maturity, is usually represented on the x-axis; the annual yield to maturity appears on the y-axis.
A yield curve is a simple plot that compares the yield investors will realize from a bond to the length of the bond. Typically, short-term bonds offer much smaller yields but are considered less risky, so they’re at the lower left-hand side of the graph. Longer-term bonds generally provide larger yields because the uncertainty about future events makes them riskier. They’re usually in the upper right-hand side of the graph.
A bond yield is simply the money you earn from the investment. Bond yields can be influenced by larger macroeconomic factors, particularly interest rates. When interest rates rise, bond prices may fall but generally become more valuable. Rising interest rates mean borrowers have to increase yields to make their bonds attractive to investors. Meanwhile, bonds that have already been issued are usually offering lower yields, making them less profitable. When interest rates fall, bond prices may rise but yields usually fall.
The yield curve is especially useful as an economic indicator. In a relatively strong economy, it’s an upward-sloping line, rising from short-term bonds with low yields to long-term bonds with higher yields. However, an inverted curve -- a downward-sloping line -- generally means stormy weather ahead for the economy.
Although the yield curve is an important indicator of future economic trends, individual investors can benefit from it as well. Brokers generally recommend investors start with a portfolio consisting of 60% equities and 40% fixed-income investments, such as bonds. U.S. governments and corporations reported almost $53 trillion in outstanding bonds at the end of 2021, about the same amount as the total value of U.S. stocks.
For most investors, however, the question isn’t whether to buy bonds; it’s whether to buy bonds that mature sooner or bonds that mature later. Short-term bonds are generally less risky but have lower yields. Longer-term bonds usually have higher yields, but their value can fluctuate.
Enter the yield curve. The most basic analysis of the yield curve involves finding a combination of safety and profitability that suits your risk appetite and investment timeline. But the yield curve doesn’t always operate in a completely linear fashion. Sometimes higher interest rates can be found with short-term bonds. When this happens, analysts refer to the inverted yield curve, typically signaling hard times are coming.
In the middle of 2022, U.S. Treasury notes displayed a standard yield curve. One-month notes -- about as short-term as any notes you can find -- offered yields of roughly 1.25% percent, while long-term notes that matured in 20 or 30 years boasted yields between 3% and 3.5%.
Standard Yield Curve
Inflation, however, was spiking. In an effort to contain it, the Federal Reserve Board increased the cost of borrowing money seven times in 2022 and added another rate hike in early 2023. Rising interest rates and inflation caused investors to worry more about a recession. A little more than six months later, the yield curve had inverted:
Generally, bond prices fall when interest rates rise. While the 20- and 30-year Treasuries were still offering yields or roughly between 3% and 3.5%, the yields of short-term notes soared past 4.5%, with six-month notes approaching 5%.
Does this mean smart investors should put their money into six-month Treasuries? Not necessarily. What happens if interest rates continue to rise? Bond yields could rise again, devaluing your purchase. Of course it all depends on your risk appetite and how you think the economy will fare in the months and years ahead. The yield curve isn’t infallible when it comes to predicting the course of the economy, but it does offer extremely useful comparisons for investors.