Accessibility Menu
Amprius Technologies logo

Amprius Technologies(NYSE) AMPX

Market Cap$1.49BMarket cap calculated using publicly traded shares outstanding only. Does not include unlisted, private, or dual-class non-traded shares. Implied market cap may vary.
Since IPO (2022)+2%
5 YearN/A
1 Year+44%
1 Month+15%
Premium Feature
Moneyball Superscore
71/100
$10.54
+3.33%
+0.34Today
After hours$10.54+$0.00 (+0.00%)
Amprius Technologies last closing stock price
MetricPriceDate
Last closeUSD 10.512026-08-27
Amprius Technologies stock price return by period
PeriodPrice returnPrice at period startPeriod start date
1 week+3.04%USD 10.202026-08-20
1 month+15.12%USD 9.132026-07-28
3 month-48.18%USD 20.282026-05-29
Year to date+33.21%USD 7.892025-12-31
1 year+43.97%USD 7.302025-08-27
3 year+132.01%USD 4.532023-08-28
Since inception+2%USD 10.002022-09-15

Amprius Technologies Financials at a Glance

Market Cap

$1.49BMarket cap calculated using publicly traded shares outstanding only. Does not include unlisted, private, or dual-class non-traded shares. Implied market cap may vary.

Revenue (TTM)

$109.23M

Net Income (TTM)

-$38.40M

EPS (TTM)

-$0.29

P/E Ratio

-35.47

Dividend

$0.00

Beta (Volatility)

1.88 (High)

Price

$10.54

Volume

3,531,425.571

Open

$10.56

Previous Close

$10.51

Daily Range

$10.35 - $10.64

52-Week Range

$6.66 - $24.23

Estimated Earnings Date

Nov 5, 2026

AMPX: Motley Fool Moneyball Superscore

71

Our CEO Is Handing Members His Secret Weapon

It's called Motley Fool Moneyball, our new proprietary AI tool

We spent over half a million dollars in R&D to build a tool that makes stock research faster, sharper, and smarter. Our analysts use it every day, and now, you can too.

Get Access Now

About Amprius Technologies

Amprius Technologies, Inc. makes powerful batteries for drones and planes. These batteries help flying vehicles travel further and stay aloft longer. They solve energy storage problems for the aerospace and defense sectors.

What's in the Box?

  • SiMaxx Batteries: High-energy density cells produced at the company's pilot facility in California.
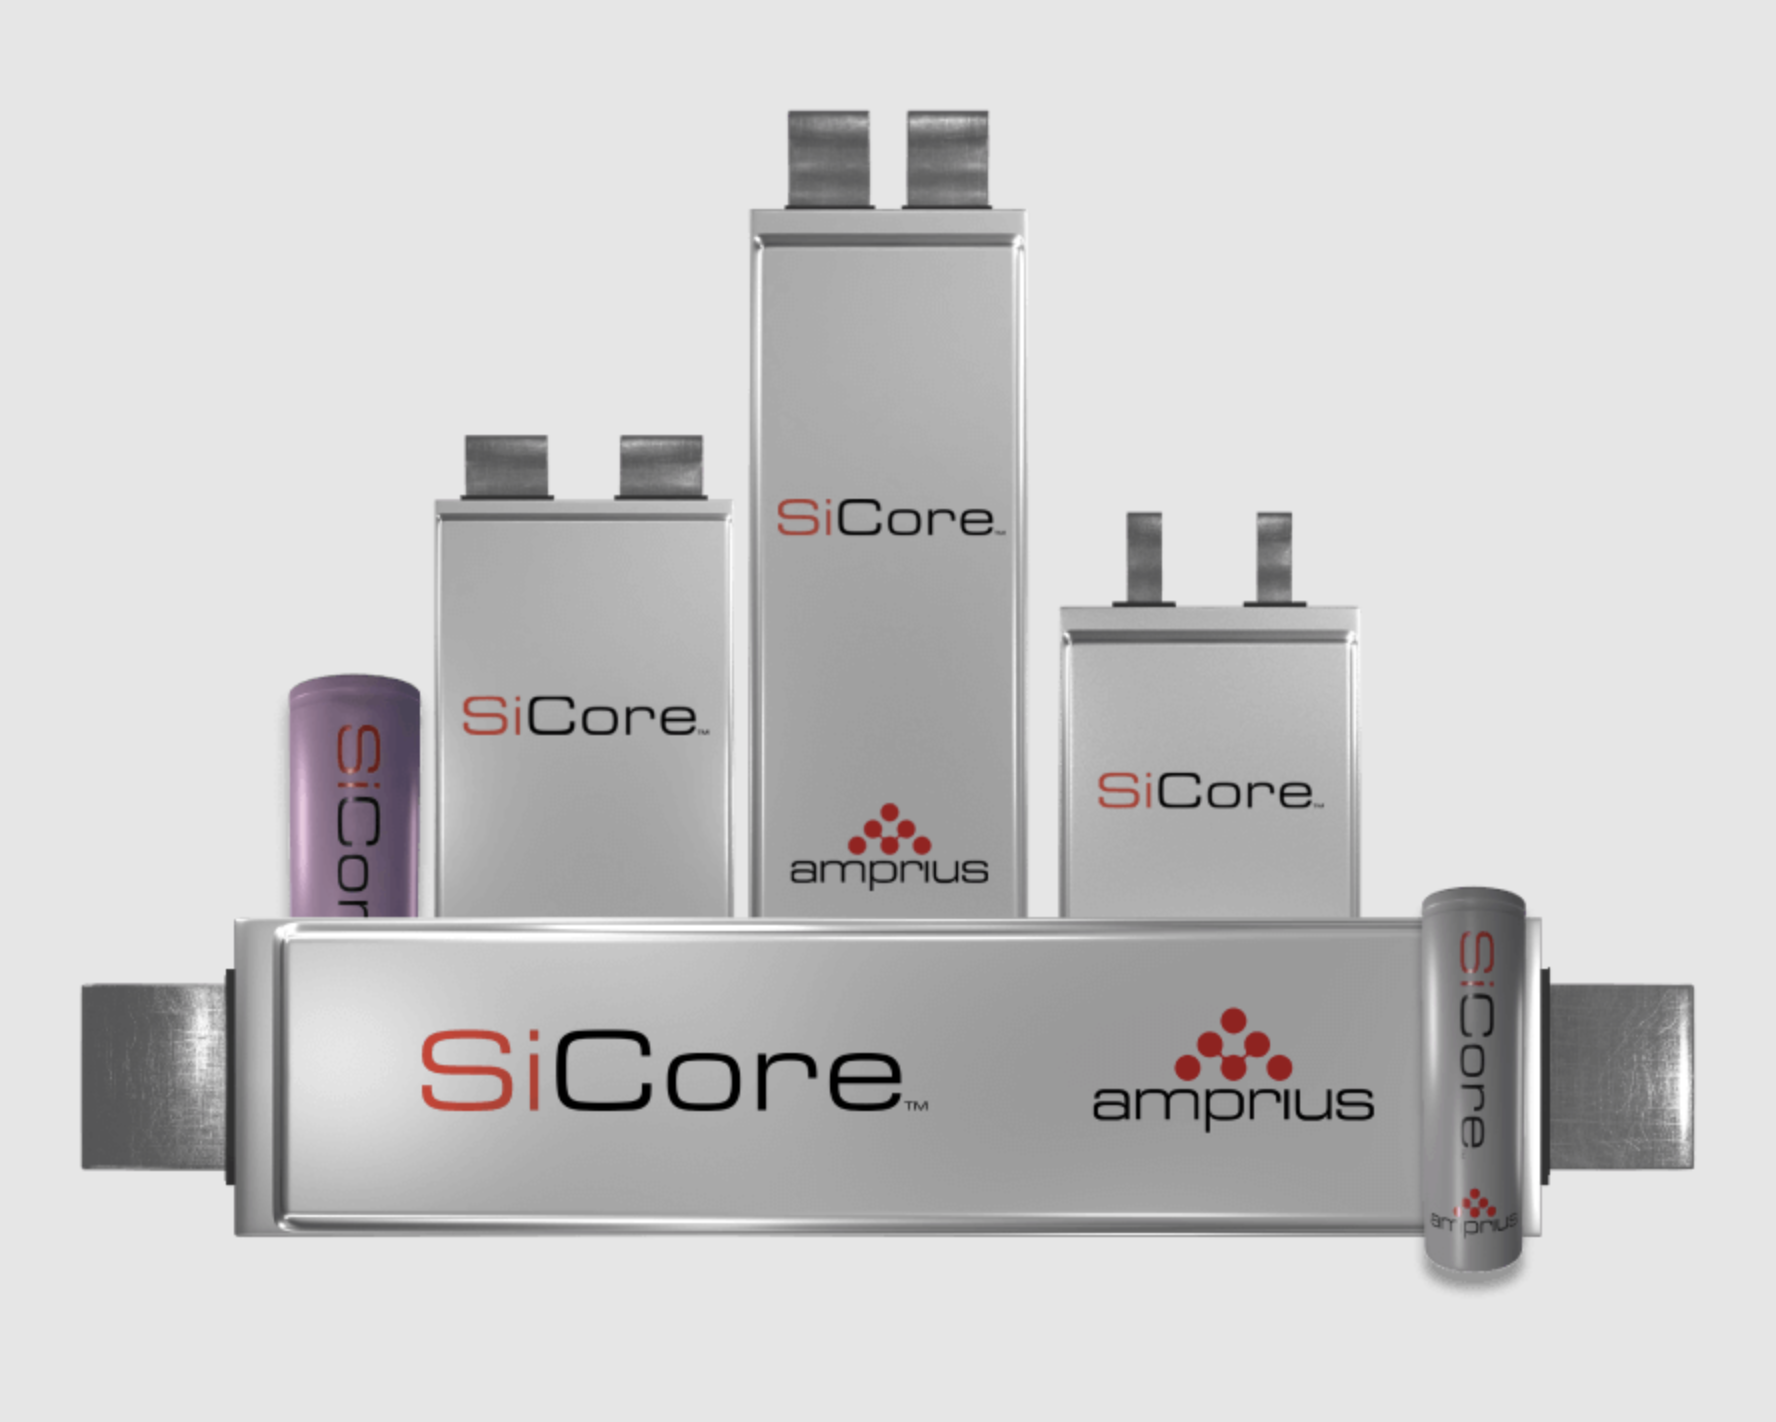
  • SiCore Batteries: Commercial-scale products developed through a partnership to meet high-volume market demand.
  • Customization Services: Engineering help for customers who need specific battery sizes or power levels.

Scaling the Business

  • Launched SiCore batteries commercially in Jan. 2024 to target broader addressable markets.
  • Formed the Amprius Korea Battery Alliance to access production capacity exceeding 2.0 gigawatt hours (GWh) annually.
  • Terminated a lease for a planned Colorado factory in Jan. 2026 to focus on outsourced manufacturing.
  • Amended a contract with the Defense Innovation Unit in July 2025 to reach $18.1 million in funding.

What Makes These Batteries Different?

The company uses silicon nanowire technology for the anode, the part of the battery that stores energy during charging. This design allows for higher energy density and faster charging than standard graphite lithium-ion batteries. Amprius uses a global network of manufacturing partners to scale production quickly with minimal capital investment.

The Scorecard

  • Revenue was $34.0 million in the three months ended June 30, 2026, up 126% year over year.
  • Gross profit reached $15.0 million for the six months ended June 30, 2026.
  • Net loss was $8.2 million in the six months ended June 30, 2026, down 48% year over year.
  • The company held $74.5 million in cash and cash equivalents as of June 30, 2026.
  • Market capitalization reached $2.0 billion in the second quarter of 2026.

Bottom Line

Amprius is transitioning from a research-focused firm to a commercial supplier of high-performance energy solutions for the aviation industry. Its strategy relies on silicon technology and global manufacturing partnerships to support the growing demand for electric transportation.

AI Generated • Aug 7, 2026

Industry

Electrical Equipment

Employees

109

CEO

Justin Evan Mirro, MBA

Headquarters

Fremont, CA 94538, US

AMPX Financials

Key Financial Metrics (TTM)

Gross Margin

22.25%

Operating Margin

-17.05%

Net Income Margin

-35.16%

Return on Equity

-34.75%

Return on Capital

-32.46%

Return on Assets

-25.74%

Earnings Yield

-2.82%

Dividend Yield

0.00%

Payout Ratio

0.00%

Stock Overview

Market Cap

$1.49BMarket cap calculated using publicly traded shares outstanding only. Does not include unlisted, private, or dual-class non-traded shares. Implied market cap may vary.

Shares Outstanding

146.08M

Volume

3.53M

Avg. Volume

6.97M

Financials (TTM)

Gross Profit

$24.31M

Operating Income

-$18.62M

EBITDA

-$34.09M

Operating Cash Flow

-$52.87M

Capital Expenditure

-$5.57M

Free Cash Flow

-$58.44M

Cash & ST Invst.

$74.52M

Total Debt

$6.38M

Amprius Technologies Performance Analysis

Amprius Technologies annual revenue and year-over-year revenue growth by fiscal year
Fiscal yearPeriod endRevenueYoY growth
20222022-12-31USD 4,409,00059.1%
20232023-12-31USD 9,053,000105.3%
20242024-12-31USD 24,167,000167.0%
20252025-12-31USD 73,011,000202.1%
Amprius Technologies sequential (quarter-over-quarter) revenue growth by fiscal quarter
Fiscal quarterPeriod endQoQ growth
Q32025-09-3042.2%
Q42025-12-3117.8%
Q12026-03-3113.1%
Q22026-06-3019.3%
Amprius Technologies annual diluted earnings per share and year-over-year EPS growth by fiscal year
Fiscal yearPeriod endDiluted EPSYoY growth
20222022-12-31USD -0.20109.0%
20232023-12-31USD -0.43108.3%
20242024-12-31USD -0.454.5%
20252025-12-31USD -0.35-20.7%
Amprius Technologies sequential (quarter-over-quarter) diluted earnings per share growth by fiscal quarter
Fiscal quarterPeriod endQoQ growth
Q32025-09-3041.3%
Q42025-12-31-486.3%
Q12026-03-3177.8%
Q22026-06-30N/A

Revenue Growth Rate

Annual and quarterly growth comparison

Earnings Per Share Growth Rate

Annual and quarterly EPS growth comparison

Quarterly Performance

Name
Q2 2026YOY CHG

Revenue

$34.03M

+125.9%

Gross Profit

$9.28M

+592.5%

Gross Margin

27.27%

N/A

Market Cap

$1.49BMarket cap calculated using publicly traded shares outstanding only. Does not include unlisted, private, or dual-class non-traded shares. Implied market cap may vary.

N/A

Market Cap/Employee

$15.36M

N/A

Employees

97

N/A

Net Income

-$5.08M

+20.3%

EBITDA

-$3.93M

+26.6%

Quarterly Fundamentals

Name
Q2 2026YOY CHG

Total Cash

$74.52M

+37.5%

Total Debt

$6.38M

-83.1%

Accounts Receivable

$40.65M

+277.6%

Inventory

$11.51M

+165.5%

Long Term Debt

$5.20M

-84.9%

Short Term Debt

$1.18M

-65.5%

Return on Assets

-25.74%

N/A

Return on Invested Capital

-14.23%

N/A

Free Cash Flow

-$4.67M

+6.2%

Operating Cash Flow

-$2.85M

+33.2%

Other Investments to Explore

People Also Watch

Symbol / CompanyPricePrice Chg
ENREnergizer Holdings, Inc.
$22.11+0.64%
CDRECadre Holdings, Inc.
$31.10-1.33%
SCSSteelcase Inc.
$16.14+0.12%
NSPInsperity, Inc.
$51.81-0.19%

Trending Stocks

Symbol / CompanyPricePrice Chg
NVDANvidia
$227.98+0.09%
INTCIntel
$92.09+0.04%
BITOProShares Trust - ProShares Bitcoin ETF
$10.78+0.02%
ONDSOndas
$8.75+0.06%

Questions About AMPX

What is the current price of Amprius Technologies?

Amprius Technologies is trading at $10.51 per share.

What is the 52-week range for Amprius Technologies?

Over the past 52 weeks, Amprius Technologies has traded between $6.66 and $24.23.

How much debt does Amprius Technologies have?

As of the most recent reporting period, Amprius Technologies reported total debt of $6.38M.

How much cash does Amprius Technologies have on hand?

Amprius Technologies reported $74.72M in cash and cash equivalents in its most recent financial results.

What is Amprius Technologies’s dividend yield?

Amprius Technologies does not currently have a dividend yield.

Premium Investing Services

Invest better with The Motley Fool. Get stock recommendations, portfolio guidance, and more from The Motley Fool's premium services.