Accessibility Menu
Kosmos Energy logo

Kosmos Energy(NYSE) KOS

Market Cap$1.76BMarket cap calculated using publicly traded shares outstanding only. Does not include unlisted, private, or dual-class non-traded shares. Implied market cap may vary.
Since IPO (2011)-83%
5 Year+49%
1 Year+70%
1 Month+12%
Premium Feature
Moneyball Superscore
42/100
$2.97
-1.82%
-0.05Today
After hours$2.96-$0.01 (-0.17%)
Kosmos Energy last closing stock price
MetricPriceDate
Last closeUSD 2.962026-08-21
Kosmos Energy stock price return by period
PeriodPrice returnPrice at period startPeriod start date
1 week+16.54%USD 2.542026-08-14
1 month+11.7%USD 2.652026-07-22
3 month-2.31%USD 3.032026-05-22
Year to date+226.21%USD 0.912025-12-31
1 year+70.11%USD 1.742025-08-21
3 year-59.23%USD 7.262023-08-22
5 year+49.49%USD 1.982021-08-20
Since inception-83%USD 17.412011-05-11

Kosmos Energy Financials at a Glance

Market Cap

$1.76BMarket cap calculated using publicly traded shares outstanding only. Does not include unlisted, private, or dual-class non-traded shares. Implied market cap may vary.

Revenue (TTM)

$1.64B

Net Income (TTM)

-$542.24M

EPS (TTM)

-$1.19

P/E Ratio

-2.49

Dividend

$0.00

Beta (Volatility)

1.12 (Average)

Price

$2.97

Volume

14,949,785.541

Open

$3.02

Previous Close

$2.96

Daily Range

$2.94 - $3.06

52-Week Range

$0.84 - $3.34

Estimated Earnings Date

Nov 2, 2026

KOS: Motley Fool Moneyball Superscore

42

Our CEO Is Handing Members His Secret Weapon

It's called Motley Fool Moneyball, our new proprietary AI tool

We spent over half a million dollars in R&D to build a tool that makes stock research faster, sharper, and smarter. Our analysts use it every day, and now, you can too.

Get Access Now

About Kosmos Energy

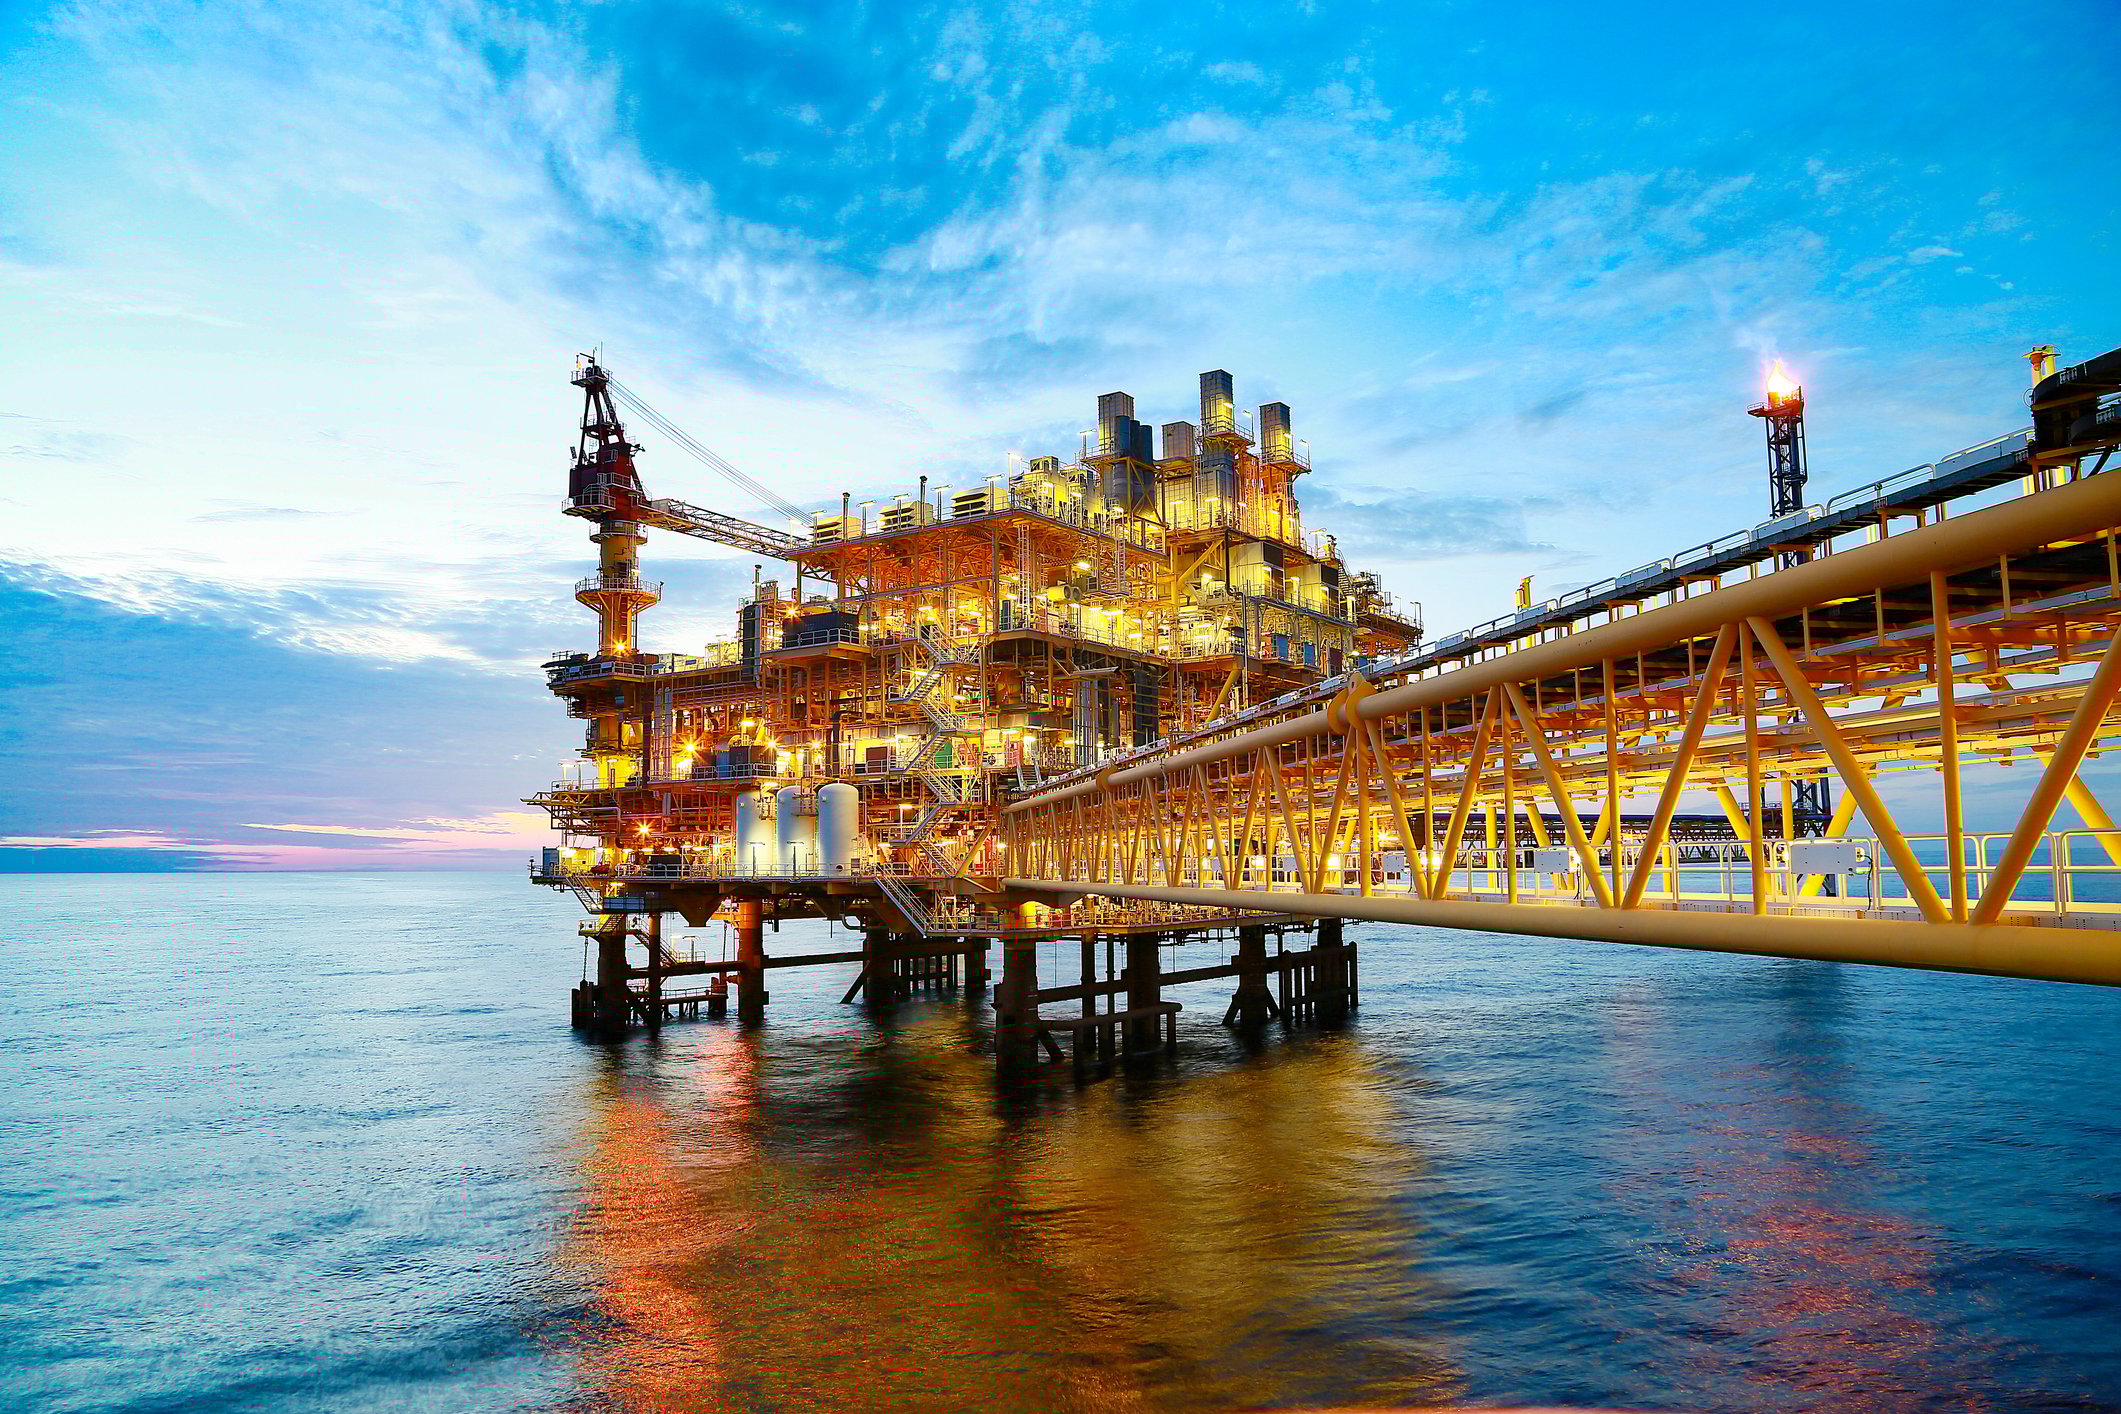
Kosmos Energy Ltd. finds energy deep under the ocean. It pumps oil and gas to power the world. This work happens offshore Africa and America.

Where the Energy Comes From

  • Deepwater Crude Oil: Liquid energy extracted from offshore fields; generated $496.3 million in revenue for the three months ended June 30, 2026.
  • Liquified Natural Gas: Natural gas cooled for shipping from Mauritania and Senegal; generated $83.6 million in revenue for the three months ended June 30, 2026.
  • Natural Gas Liquids: Energy products collected during the extraction process; generated $27.4 million in revenue for the three months ended June 30, 2026.

Changing the Asset Mix

  • Sold all participating interest in the Ceiba Field and Okume Complex in Equatorial Guinea in June 2026.
  • Received final cash consideration of $127 million from the Equatorial Guinea asset sale.
  • Reached a final investment decision for the Tiberius development in March 2026.
  • Added Navitas as a partner for the Tiberius project in July 2026 following a competitive farm-out process.
  • Achieved the first cargo shipment of liquified natural gas from the Greater Tortue Ahmeyim project in April 2025.

What Makes Kosmos Different?

The company focuses on deepwater basins along the Atlantic Margins using specialized expertise to find and extract resources. Its operations use complex infrastructure, including floating production ships and subsea pipelines, to connect underwater fields to global energy markets.

A Look at the Numbers

  • Total oil and gas revenue was $607.3 million for the three months ended June 30, 2026, compared to $392.6 million for the same period in 2025.
  • Net income was $184.8 million for the three months ended June 30, 2026, up from a net loss of $87.7 million in 2025.
  • Oil and gas production costs decreased to $179.4 million for the three months ended June 30, 2026, from $243.1 million in the prior-year period.
  • Total long-term debt was $2.7 billion as of June 30, 2026.
  • Market capitalization was $1.2 billion for the second quarter of 2026.

The Big Picture

Kosmos has evolved from a pure exploration firm into a diversified producer with assets across three continents. Its focus on high-margin deepwater projects helps it manage debt while advancing new energy developments.

AI Generated • Aug 4, 2026

Industry

Oil, Gas and Consumable Fuels

Sector

Energy

Employees

216

CEO

Andrew G. Inglis

Headquarters

Dallas, TX 75231, US

KOS Financials

Key Financial Metrics (TTM)

Gross Margin

36.10%

Operating Margin

19.70%

Net Income Margin

-33.11%

Return on Equity

-81.93%

Return on Capital

-7.54%

Return on Assets

-12.58%

Earnings Yield

-40.16%

Dividend Yield

0.00%

Payout Ratio

0.00%

Stock Overview

Market Cap

$1.76BMarket cap calculated using publicly traded shares outstanding only. Does not include unlisted, private, or dual-class non-traded shares. Implied market cap may vary.

Shares Outstanding

595.49M

Volume

14.95M

Avg. Volume

14.46M

Financials (TTM)

Gross Profit

$591.21M

Operating Income

$322.63M

EBITDA

$206.50M

Operating Cash Flow

$289.30M

Capital Expenditure

-$305.12M

Free Cash Flow

-$15.82M

Cash & ST Invst.

$125.64M

Total Debt

$2.76B

Kosmos Energy Performance Analysis

Kosmos Energy annual revenue and year-over-year revenue growth by fiscal year
Fiscal yearPeriod endRevenueYoY growth
20222022-12-31USD 2,259,928,00068.7%
20232023-12-31USD 1,718,829,000-23.9%
20242024-12-31USD 1,680,208,000-2.2%
20252025-12-31USD 1,297,846,000-22.8%
Kosmos Energy sequential (quarter-over-quarter) revenue growth by fiscal quarter
Fiscal quarterPeriod endQoQ growth
Q32025-09-30-20.7%
Q42025-12-31-4.4%
Q12026-03-3141.8%
Q22026-06-3044.0%
Kosmos Energy annual diluted earnings per share and year-over-year EPS growth by fiscal year
Fiscal yearPeriod endDiluted EPSYoY growth
20222022-12-31USD 0.48N/A
20232023-12-31USD 0.44-7.0%
20242024-12-31USD 0.40-10.3%
20252025-12-31USD -1.47N/A
Kosmos Energy sequential (quarter-over-quarter) diluted earnings per share growth by fiscal quarter
Fiscal quarterPeriod endQoQ growth
Q32025-09-30-44.4%
Q42025-12-31-203.8%
Q12026-03-3143.0%
Q22026-06-30168.9%

Revenue Growth Rate

Annual and quarterly growth comparison

Earnings Per Share Growth Rate

Annual and quarterly EPS growth comparison

Quarterly Performance

Name
Q2 2026YOY CHG

Revenue

$607.25M

+54.7%

Gross Profit

$427.82M

+24533.1%

Gross Margin

70.45%

N/A

Market Cap

$1.76BMarket cap calculated using publicly traded shares outstanding only. Does not include unlisted, private, or dual-class non-traded shares. Implied market cap may vary.

N/A

Market Cap/Employee

$8.16M

N/A

Employees

216

N/A

Net Income

$184.78M

+310.6%

EBITDA

$336.17M

+125.2%

Quarterly Fundamentals

Name
Q2 2026YOY CHG

Total Cash

$125.64M

+143.0%

Total Debt

$2.76B

-3.3%

Accounts Receivable

$113.02M

-4.1%

Inventory

$139.95M

-14.2%

Long Term Debt

$2.53B

-2.5%

Short Term Debt

$221.57M

-11.4%

Return on Assets

-12.58%

N/A

Return on Invested Capital

8.85%

N/A

Free Cash Flow

$98.58M

+120.8%

Operating Cash Flow

$175.01M

+37.6%

Other Investments to Explore

People Also Watch

Symbol / CompanyPricePrice Chg
NGLNGL Energy Partners LP
$16.81-1.41%
PDSPrecision Drilling Corporation
$91.69+2.88%
HPKHighPeak Energy, Inc.
$8.32+0.12%
CAPLCrossAmerica Partners LP
$23.84-0.67%

Trending Stocks

Symbol / CompanyPricePrice Chg
TSLLDirexion Shares ETF Trust - Direxion Daily Tsla Bull 2x ETF
$9.77+0.10%
IBITiShares Bitcoin Trust
$43.68+0.06%
BITOProShares Trust - ProShares Bitcoin ETF
$10.41+0.06%
MARAMara Holdings
$11.26+0.01%

Questions About KOS

What is the current price of Kosmos Energy?

Kosmos Energy is trading at $2.96 per share.

What is the 52-week range for Kosmos Energy?

Over the past 52 weeks, Kosmos Energy has traded between $0.84 and $3.34.

How much debt does Kosmos Energy have?

As of the most recent reporting period, Kosmos Energy reported total debt of $2.76B.

How much cash does Kosmos Energy have on hand?

Kosmos Energy reported $125.64M in cash and cash equivalents in its most recent financial results.

What is Kosmos Energy’s dividend yield?

Kosmos Energy does not currently have a dividend yield.

Premium Investing Services

Invest better with The Motley Fool. Get stock recommendations, portfolio guidance, and more from The Motley Fool's premium services.