Accessibility Menu
Chevron logo

Chevron(NYSE) CVX

Market Cap$406.49BMarket cap calculated using publicly traded shares outstanding only. Does not include unlisted, private, or dual-class non-traded shares. Implied market cap may vary.
Since IPO (1968)+63,614%
5 Year+164%
1 Year+38%
1 Month+10%
$203.97
+1.51%
+3.02Today
After hours$204.02+$0.05 (+0.02%)
Chevron last closing stock price
MetricPriceDate
Last closeUSD 203.962026-08-18
Chevron stock price return by period
PeriodPrice returnPrice at period startPeriod start date
1 week+4.62%USD 194.962026-08-11
1 month+9.8%USD 185.762026-07-17
3 month+7.53%USD 189.672026-05-20
Year to date+37.56%USD 148.272025-12-31
1 year+38.01%USD 147.792025-08-18
3 year+43.71%USD 141.932023-08-18
5 year+164.32%USD 77.162021-08-19
Since inception+63,614.25%USD 0.321968-01-02

Chevron Financials at a Glance

Market Cap

$406.49BMarket cap calculated using publicly traded shares outstanding only. Does not include unlisted, private, or dual-class non-traded shares. Implied market cap may vary.

Revenue (TTM)

$208.71B

Net Income (TTM)

$20.59B

EPS (TTM)

$10.43

P/E Ratio

19.72

Dividend

$6.98

Beta (Volatility)

0.48 (Low)

Price

$203.97

Volume

5,029.636

Open

$203.26

Previous Close

$203.96

Daily Range

$201.95 - $204.44

52-Week Range

$146.49 - $214.71

Estimated Earnings Date

Oct 30, 2026

CVX: Motley Fool Moneyball Superscore

67

Our CEO Is Handing Members His Secret Weapon

It's called Motley Fool Moneyball, our new proprietary AI tool

We spent over half a million dollars in R&D to build a tool that makes stock research faster, sharper, and smarter. Our analysts use it every day, and now, you can too.

Get Access Now

About Chevron

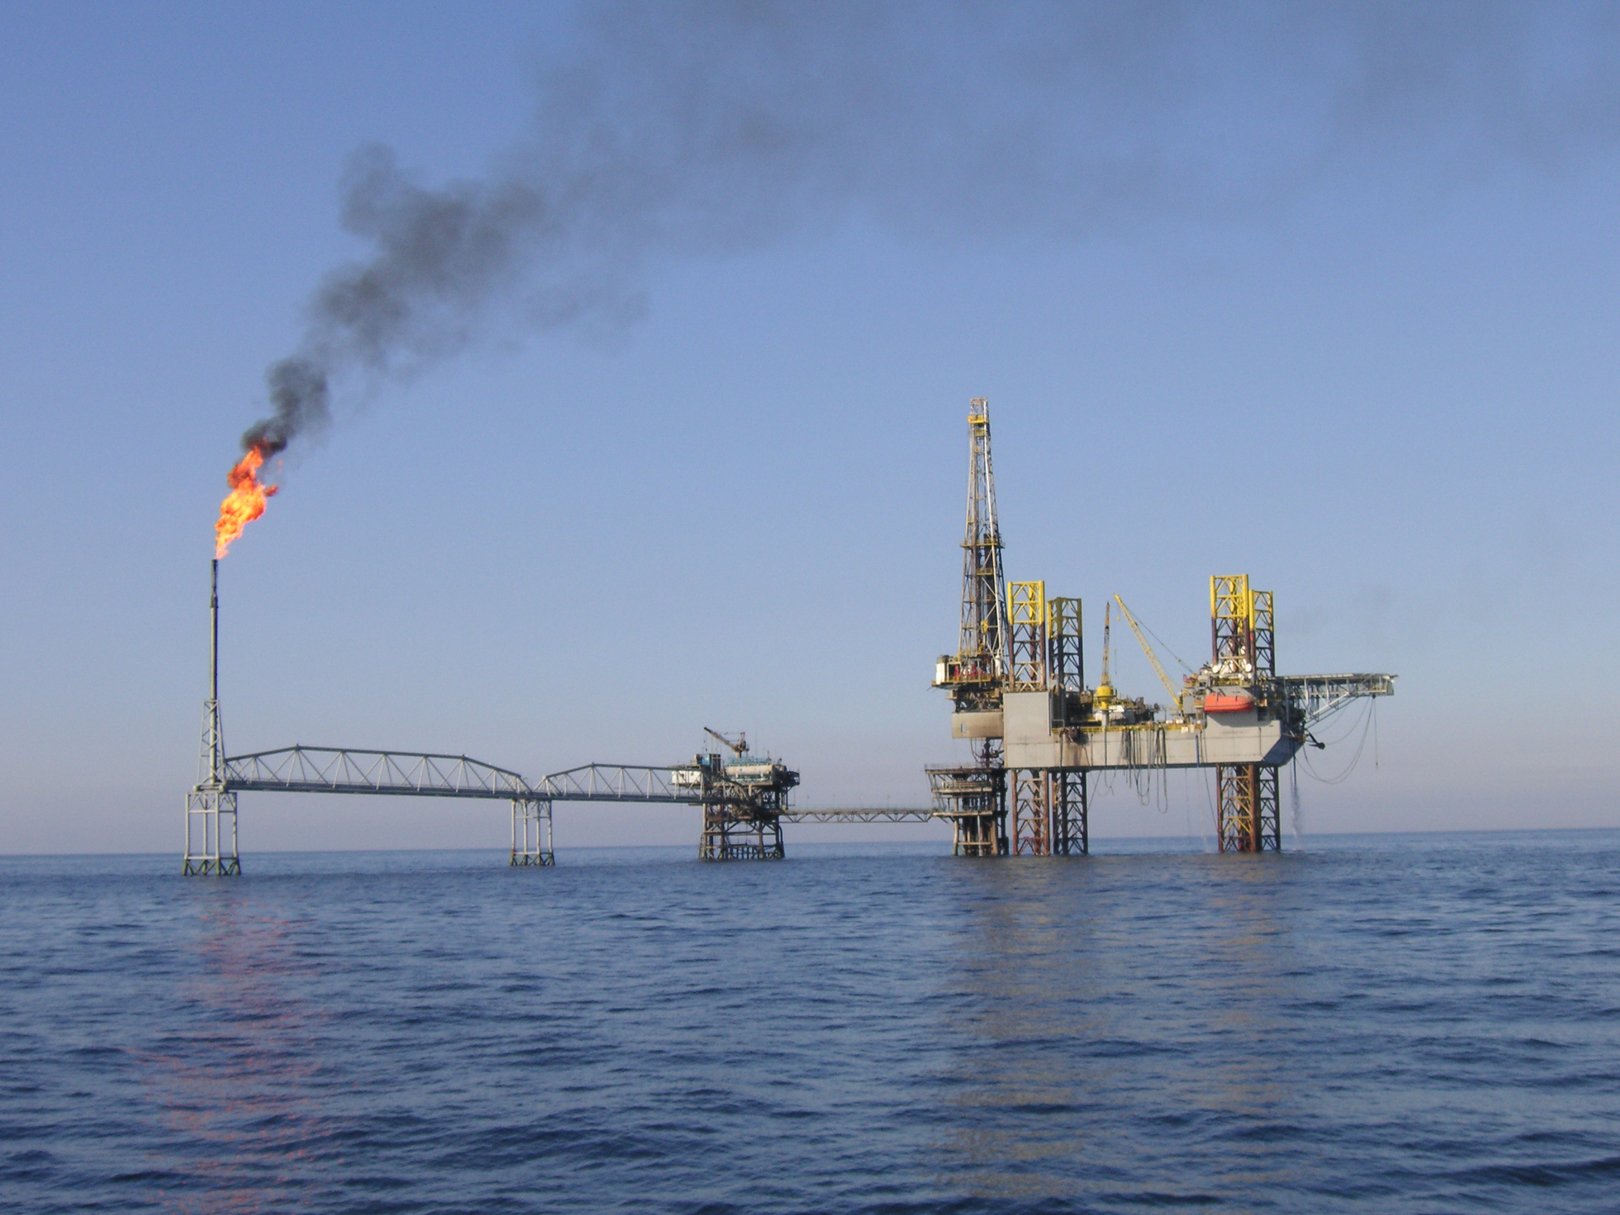
Chevron Corporation helps people fuel cars and heat homes. It finds oil and gas from sites around the world. These resources become gasoline and other products for daily life.

Energy from Earth to Engine

  • Upstream Operations: Exploring for and producing crude oil and natural gas across a global portfolio of assets.
  • Downstream Operations: Refining crude oil into refined products including gasoline, diesel, jet fuel, and lubricants.
  • Chemicals and Additives: Manufacturing petrochemicals and plastics through interests in affiliates such as CPChem.
  • New Energies: Developing lower carbon solutions including renewable fuels, hydrogen, and carbon capture technology.

Expanding the Global Portfolio

  • Completed the acquisition of Hess Corporation in July 2025 to expand production and resource capabilities.
  • Finalized the sale of downstream fuels and lubricants businesses in Hong Kong during the second quarter of 2026.
  • Signed a 20-year power purchase agreement with Microsoft to develop a power facility in West Texas.
  • Reached an agreement to sell several downstream assets in the Asia-Pacific region, with closing expected in 2027.
  • Signed agreements with the government of Iraq to advance participation in major oilfield developments.

Operational Strength and Efficiency

Chevron integrates its global supply chain from initial resource discovery to the final sale of refined products. The company achieved $3 billion in annual cost reductions six months ahead of its original schedule in 2026.

By the Numbers

  • Net income reached $12.1 billion in the second quarter of 2026, compared with $2.5 billion in the second quarter of 2025.
  • Cash provided by operating activities was $25.1 billion in the first six months of 2026, up from $13.8 billion year over year.
  • Worldwide net oil-equivalent production averaged 4.0 million barrels per day in the first six months of 2026, up 18% year over year.
  • Free cash flow hit $16.5 billion in the first six months of 2026, compared with $6.1 billion in the year-ago period.
  • Total debt and finance lease liabilities fell to $37.1 billion by June 30, 2026, down from $40.8 billion at the end of 2025.

Evolution Toward a Lower Carbon Future

Chevron has transformed from a traditional oil company into a diverse energy provider focusing on operational efficiency and new energy technologies. Its integration of major acquisitions while divesting noncore assets demonstrates a focus on long-term value growth and portfolio optimization.

AI Generated • Aug 7, 2026

Industry

Oil, Gas and Consumable Fuels

Sector

Energy

Employees

43,039

CEO

Michael K. Wirth

Headquarters

Houston, TX 77002-7327, US

CVX Financials

Key Financial Metrics (TTM)

Gross Margin

31.00%

Operating Margin

15.83%

Net Income Margin

9.87%

Return on Equity

10.98%

Return on Capital

7.15%

Return on Assets

6.24%

Earnings Yield

5.07%

Dividend Yield

3.39%

Payout Ratio

84.45%

Stock Overview

Market Cap

$406.49BMarket cap calculated using publicly traded shares outstanding only. Does not include unlisted, private, or dual-class non-traded shares. Implied market cap may vary.

Shares Outstanding

1.98B

Volume

5.03K

Avg. Volume

8.85M

Financials (TTM)

Gross Profit

$64.69B

Operating Income

$33.04B

EBITDA

$55.77B

Operating Cash Flow

$47.65B

Capital Expenditure

-$22.31B

Free Cash Flow

$25.34B

Cash & ST Invst.

$8.53B

Total Debt

$37.08B

Chevron Performance Analysis

Chevron annual revenue and year-over-year revenue growth by fiscal year
Fiscal yearPeriod endRevenueYoY growth
20222022-12-31USD 236,368,000,00051.2%
20232023-12-31USD 197,217,000,000-16.6%
20242024-12-31USD 193,471,000,000-1.9%
20252025-12-31USD 184,534,000,000-4.6%
Chevron sequential (quarter-over-quarter) revenue growth by fiscal quarter
Fiscal quarterPeriod endQoQ growth
Q32025-09-308.5%
Q42025-12-31-4.9%
Q12026-03-313.9%
Q22026-06-3041.3%
Chevron annual diluted earnings per share and year-over-year EPS growth by fiscal year
Fiscal yearPeriod endDiluted EPSYoY growth
20222022-12-31USD 18.28124.6%
20232023-12-31USD 11.37-37.8%
20242024-12-31USD 9.72-14.5%
20252025-12-31USD 6.63-31.8%
Chevron sequential (quarter-over-quarter) diluted earnings per share growth by fiscal quarter
Fiscal quarterPeriod endQoQ growth
Q32025-09-3025.5%
Q42025-12-31-23.6%
Q12026-03-31-20.1%
Q22026-06-30450.5%

Revenue Growth Rate

Annual and quarterly growth comparison

Earnings Per Share Growth Rate

Annual and quarterly EPS growth comparison

Quarterly Performance

Name
Q2 2026YOY CHG

Revenue

$67.20B

+51.4%

Gross Profit

$30.59B

+132.2%

Gross Margin

45.52%

N/A

Market Cap

$406.49BMarket cap calculated using publicly traded shares outstanding only. Does not include unlisted, private, or dual-class non-traded shares. Implied market cap may vary.

N/A

Market Cap/Employee

$9.44M

N/A

Employees

43,039

N/A

Net Income

$12.07B

+384.8%

EBITDA

$23.12B

+161.8%

Quarterly Fundamentals

Name
Q2 2026YOY CHG

Total Cash

$8.53B

+108.4%

Total Debt

$37.08B

+25.8%

Accounts Receivable

$25.26B

+43.0%

Inventory

$10.55B

+19.8%

Long Term Debt

$37.08B

+59.3%

Short Term Debt

$0.00

-100.0%

Return on Assets

6.24%

N/A

Return on Invested Capital

11.24%

N/A

Free Cash Flow

$16.81B

+245.5%

Operating Cash Flow

$25.15B

+193.2%

Other Investments to Explore

People Also Watch

Symbol / CompanyPricePrice Chg
SHELShell plc
$92.01+0.43%
TTETotalEnergies SE
$89.29+0.74%
XOMExxon Mobil Corporation
$165.62+2.58%
PBRPetróleo Brasileiro S.A. - Petrobras
$18.18-0.38%

Trending Stocks

Symbol / CompanyPricePrice Chg
KORUDirexion Shares ETF Trust - Direxion Daily Msci South Korea Bull 3x Shares
$17.84-0.24%
SOXSDirexion Shares ETF Trust - Direxion Daily Semiconductor Bear 3x ETF
$44.19+0.15%
SOXLDirexion Shares ETF Trust - Direxion Daily Semiconductor Bull 3x ETF
$129.10-0.15%
SQQQProShares Trust - ProShares UltraPro Short Qqq
$38.28+0.05%

Questions About CVX

What is the current price of Chevron?

Chevron is trading at $203.96 per share.

What is the 52-week range for Chevron?

Over the past 52 weeks, Chevron has traded between $146.49 and $214.71.

How much debt does Chevron have?

As of the most recent reporting period, Chevron reported total debt of $37.08B.

How much cash does Chevron have on hand?

Chevron reported $8.76B in cash and cash equivalents in its most recent financial results.

What is Chevron’s dividend yield?

Chevron currently has a dividend yield of 3.39%.

Premium Investing Services

Invest better with The Motley Fool. Get stock recommendations, portfolio guidance, and more from The Motley Fool's premium services.