Accessibility Menu
Amkor Technology logo

Amkor Technology(NASDAQ) AMKR

Market Cap$10.59BMarket cap calculated using publicly traded shares outstanding only. Does not include unlisted, private, or dual-class non-traded shares. Implied market cap may vary.
Since IPO (1998)+245%
5 Year+85%
1 Year+72%
1 Month-48%
$48.21
+12.83%
+5.48Today
Amkor Technology last closing stock price
MetricPriceDate
Last closeUSD 42.732026-07-29
Amkor Technology stock price return by period
PeriodPrice returnPrice at period startPeriod start date
1 week-36.2%USD 66.972026-07-22
1 month-48.11%USD 82.342026-06-29
3 month-38.67%USD 69.672026-04-30
Year to date+8.56%USD 39.362025-12-31
1 year+71.84%USD 24.872025-07-29
3 year+51.35%USD 28.232023-07-28
5 year+85.49%USD 23.042021-07-30
Since inception+245.43%USD 12.371998-05-01

Amkor Technology Financials at a Glance

Market Cap

$10.59BMarket cap calculated using publicly traded shares outstanding only. Does not include unlisted, private, or dual-class non-traded shares. Implied market cap may vary.

Revenue (TTM)

$7.46B

Net Income (TTM)

$555.45M

EPS (TTM)

$2.23

P/E Ratio

19.17

Dividend

$0.33

Beta (Volatility)

1.94 (High)

Price

$48.21

Volume

5,496,977.227

Open

$47.15

Previous Close

$42.73

Daily Range

$46.35 - $48.84

52-Week Range

$21.57 - $96.68

Estimated Earnings Date

Oct 26, 2026

AMKR: Motley Fool Moneyball Superscore

74

Our CEO Is Handing Members His Secret Weapon

It's called Motley Fool Moneyball, our new proprietary AI tool

We spent over half a million dollars in R&D to build a tool that makes stock research faster, sharper, and smarter. Our analysts use it every day, and now, you can too.

Get Access Now

About Amkor Technology

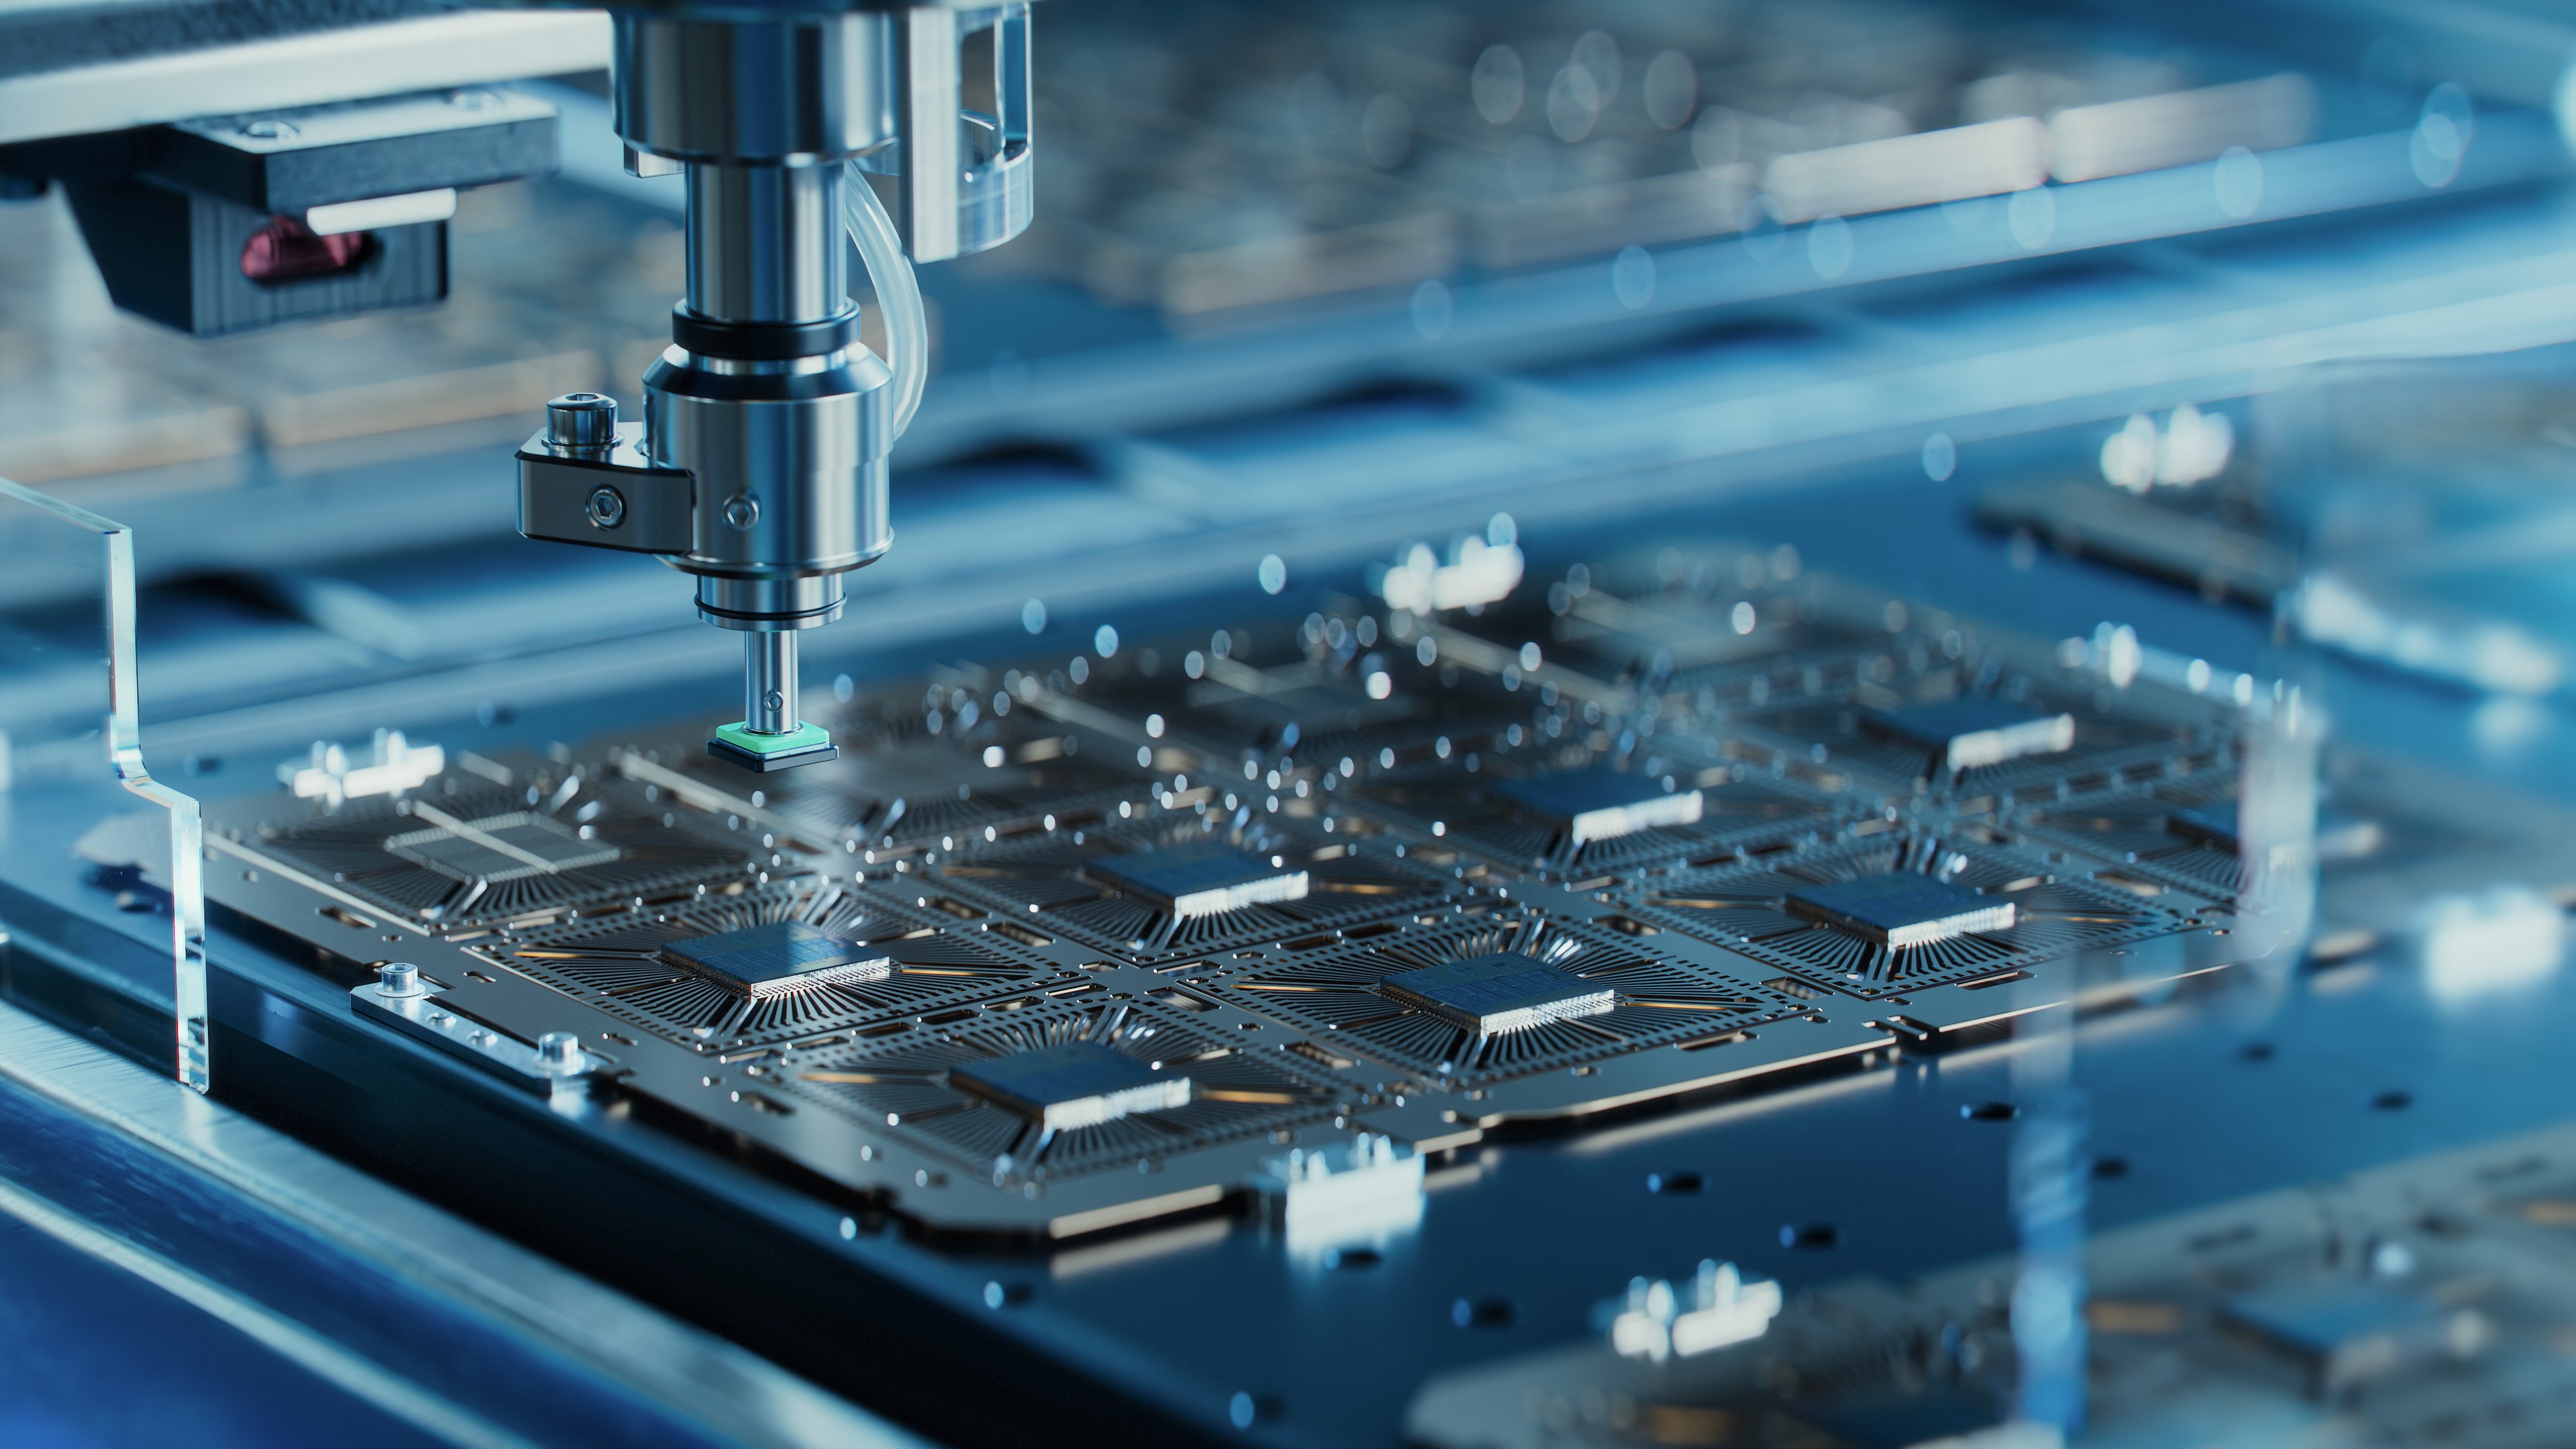
Amkor helps electronics companies put tiny chips into protective cases. These cases let chips connect to devices like phones and cars. The company also tests these parts to make sure they work correctly.

Inside the Technology Box

  • Advanced Products: Includes flip chip, memory, and wafer-level packaging for high-end devices; accounts for 83% of net sales in 2025.
  • Mainstream Products: Traditional wirebond and leadframe packaging for analog and power chips; accounts for 17% of net sales in 2025.
  • Test Services: Quality checks for semiconductors before and after packaging, including wafer-level and system-level testing.
  • Advanced SiP Modules: Systems that combine many electronic parts into one single package for smartphones and wearable tech.

Where Amkor is Growing

  • Opened a new manufacturing facility in Bac Ninh, Vietnam in 2024 to increase capacity for advanced packaging.
  • Started construction on a new large-scale facility in Arizona, United States during the second half of 2025.
  • Focused research on Heterogeneous Integration, which combines different types of chips into one high-performance module.
  • Developed Co-Packaged Optics technology to help data centers and artificial intelligence systems move data faster.

A Global Production Network

Amkor operates a broad manufacturing base across Asia, Europe, and the United States to protect against local supply chain disruptions. The company uses its long-standing partnerships with top chip designers to co-develop new ways to make electronics smaller and more powerful.

The Recent Scorecard

  • Net sales reached $6.7 billion in 2025, up 6.2% from 2024.
  • Net income hit $171.8 million in Q4 2025, a 62.6% increase over Q4 2024.
  • Operating income grew to $185 million in Q4 2025, up 37.6% year-over-year.
  • Operating cash flow rose to $644.5 million in Q4 2025, up 19.9% from the previous year.

Bottom Line

Amkor has shifted its focus toward advanced packaging for artificial intelligence and automotive markets. This move from traditional methods to high-end technology supports its role in the global semiconductor supply chain.

AI Generated • Apr 21, 2026

Industry

Semiconductors and Semiconductor Equipment

Employees

30,800

CEO

Kevin K. Engel

Headquarters

Tempe, AZ 85284, US

AMKR Financials

Key Financial Metrics (TTM)

Gross Margin

15.51%

Operating Margin

8.64%

Net Income Margin

7.45%

Return on Equity

12.37%

Return on Capital

7.74%

Return on Assets

5.72%

Earnings Yield

5.22%

Dividend Yield

0.78%

Payout Ratio

14.85%

Stock Overview

Market Cap

$10.59BMarket cap calculated using publicly traded shares outstanding only. Does not include unlisted, private, or dual-class non-traded shares. Implied market cap may vary.

Shares Outstanding

247.87M

Volume

5.50M

Avg. Volume

5.97M

Financials (TTM)

Gross Profit

$1.16B

Operating Income

$644.04M

EBITDA

$1.39B

Operating Cash Flow

$1.19B

Capital Expenditure

-$678.53M

Free Cash Flow

$516.04M

Cash & ST Invst.

$2.51B

Total Debt

$2.55B

Amkor Technology Performance Analysis

Amkor Technology annual revenue and year-over-year revenue growth by fiscal year
Fiscal yearPeriod endRevenueYoY growth
20222022-12-31USD 7,091,585,00015.5%
20232023-12-31USD 6,503,065,000-8.3%
20242024-12-31USD 6,317,692,000-2.9%
20252025-12-31USD 6,707,981,0006.2%
Amkor Technology sequential (quarter-over-quarter) revenue growth by fiscal quarter
Fiscal quarterPeriod endQoQ growth
Q32025-09-3031.5%
Q42025-12-31-5.0%
Q12026-03-31-10.8%
Q22026-06-3012.7%
Amkor Technology annual diluted earnings per share and year-over-year EPS growth by fiscal year
Fiscal yearPeriod endDiluted EPSYoY growth
20222022-12-31USD 3.1118.9%
20232023-12-31USD 1.46-53.2%
20242024-12-31USD 1.43-1.9%
20252025-12-31USD 1.505.3%
Amkor Technology sequential (quarter-over-quarter) diluted earnings per share growth by fiscal quarter
Fiscal quarterPeriod endQoQ growth
Q32025-09-30131.8%
Q42025-12-3135.3%
Q12026-03-31-52.2%
Q22026-06-30112.1%

Revenue Growth Rate

Annual and quarterly growth comparison

Earnings Per Share Growth Rate

Annual and quarterly EPS growth comparison

Quarterly Performance

Name
Q2 2026YOY CHG

Revenue

$1.90B

+25.6%

Gross Profit

$318.59M

+75.1%

Gross Margin

16.79%

N/A

Market Cap

$10.59BMarket cap calculated using publicly traded shares outstanding only. Does not include unlisted, private, or dual-class non-traded shares. Implied market cap may vary.

N/A

Market Cap/Employee

$343.88K

N/A

Employees

30,800

N/A

Net Income

$173.75M

+219.3%

EBITDA

$399.80M

+54.4%

Quarterly Fundamentals

Name
Q2 2026YOY CHG

Total Cash

$2.51B

+22.9%

Total Debt

$2.55B

+45.4%

Accounts Receivable

$1.42B

+26.2%

Inventory

$560.68M

+49.4%

Long Term Debt

$2.37B

+82.4%

Short Term Debt

$173.55M

-61.5%

Return on Assets

5.72%

N/A

Return on Invested Capital

8.48%

N/A

Free Cash Flow

$461.09M

+310.7%

Operating Cash Flow

$236.49M

-8.5%

Other Investments to Explore

People Also Watch

Symbol / CompanyPricePrice Chg
RMBSRambus Inc.
$88.80+7.23%
SWKSSkyworks Solutions, Inc.
$61.55+0.58%
ONTOOnto Innovation Inc.
$249.59+14.33%
NVMINova Ltd.
$396.09+7.95%

Trending Stocks

Symbol / CompanyPricePrice Chg
INTCIntel
$92.41+0.13%
NOKNokia
$9.01+0.07%
MSFTMicrosoft
$456.86+0.17%
NVDANvidia
$193.74+0.02%

Questions About AMKR

What is the current price of Amkor Technology?

Amkor Technology is trading at $48.22 per share.

What is the 52-week range for Amkor Technology?

Over the past 52 weeks, Amkor Technology has traded between $21.57 and $96.68.

How much debt does Amkor Technology have?

As of the most recent reporting period, Amkor Technology reported total debt of $2.67B.

How much cash does Amkor Technology have on hand?

Amkor Technology reported $1.55B in cash and cash equivalents in its most recent financial results.

What is Amkor Technology’s dividend yield?

Amkor Technology currently has a dividend yield of 0.78%.

Premium Investing Services

Invest better with The Motley Fool. Get stock recommendations, portfolio guidance, and more from The Motley Fool's premium services.