Accessibility Menu
Daktronics logo

Daktronics(NASDAQ) DAKT

Market Cap$952.66MMarket cap calculated using publicly traded shares outstanding only. Does not include unlisted, private, or dual-class non-traded shares. Implied market cap may vary.
Since IPO (1994)+2,663%
5 Year+221%
1 Year+17%
1 Month-3%
$19.58
-0.76%
-0.15Today
Daktronics last closing stock price
MetricPriceDate
Last closeUSD 19.592026-07-29
Daktronics stock price return by period
PeriodPrice returnPrice at period startPeriod start date
1 week+1.5%USD 19.302026-07-22
1 month-2.97%USD 20.192026-06-29
3 month-0.36%USD 19.662026-04-30
Year to date-0.91%USD 19.772025-12-31
1 year+16.75%USD 16.782025-07-29
3 year+179.06%USD 7.022023-07-28
5 year+220.62%USD 6.112021-07-30
Since inception+2,662.56%USD 0.711994-02-10

Daktronics Financials at a Glance

Market Cap

$952.66MMarket cap calculated using publicly traded shares outstanding only. Does not include unlisted, private, or dual-class non-traded shares. Implied market cap may vary.

Revenue (TTM)

$838.71M

Net Income (TTM)

$45.38M

EPS (TTM)

$0.92

P/E Ratio

21.50

Dividend

$0.00

Beta (Volatility)

1.04 (Average)

Price

$19.58

Volume

495,661.347

Open

$19.67

Previous Close

$19.59

Daily Range

$19.19 - $19.81

52-Week Range

$15.59 - $28.27

Estimated Earnings Date

Sep 9, 2026

DAKT: Motley Fool Moneyball Superscore

68

Our CEO Is Handing Members His Secret Weapon

It's called Motley Fool Moneyball, our new proprietary AI tool

We spent over half a million dollars in R&D to build a tool that makes stock research faster, sharper, and smarter. Our analysts use it every day, and now, you can too.

Get Access Now

About Daktronics

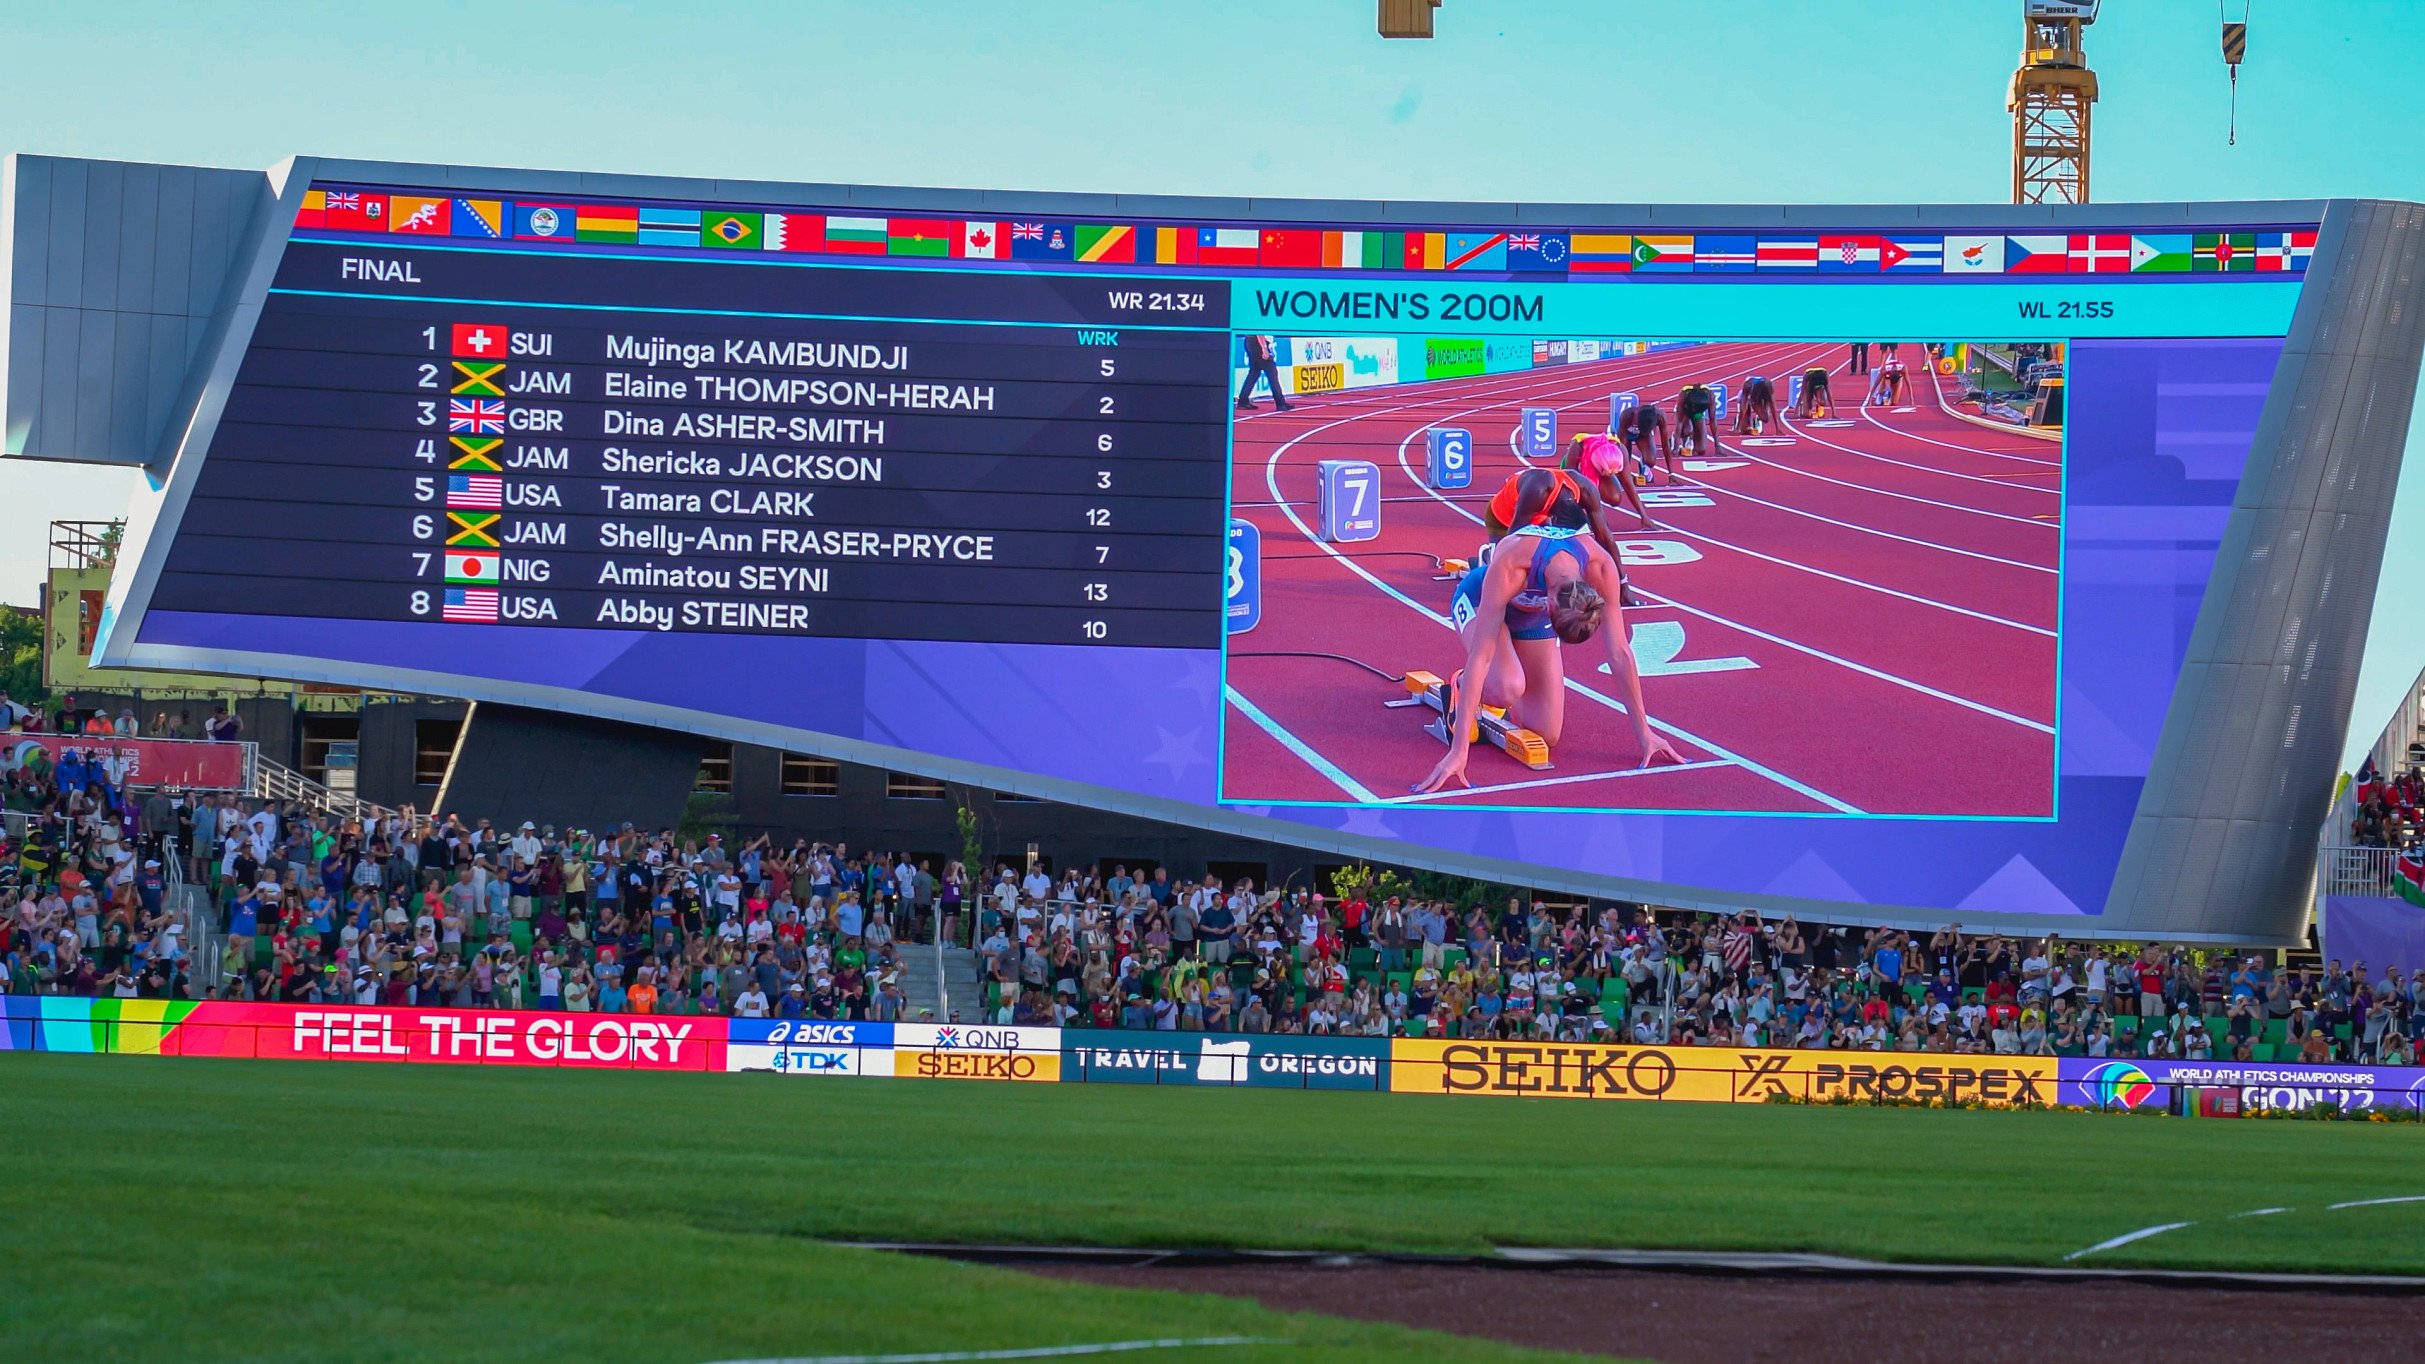
Daktronics makes digital screens and scoreboards for public spaces. They help schools and stadiums share scores and videos. Their signs also show traffic information to drivers.

What Daktronics Builds

  • Live Events: Video displays and scoring systems for professional sports and large venues; includes centerhung displays and ribbon boards.
  • Commercial: Digital billboards and large-scale video projects used by advertisers and retail businesses.
  • High School Park and Recreation: Scoreboards and video screens designed specifically for schools and local community sports.
  • Transportation: Dynamic message signs for roads and airports used to manage traffic and guide travelers.
  • Software and Controllers: Management systems like the Venus Control Suite that handle content and real-time data across display networks.

Growth and Expansion

  • Planned the opening of a new manufacturing facility in Mexico with production expected to start in fiscal 2027.
  • Entered into a new $71.5 million senior credit facility in November 2025 to increase financial flexibility.
  • Settled all outstanding financial obligations related to its Convertible Note during fiscal 2025.
  • Increased investments in micro-LED and narrow pixel pitch technologies to meet demand for higher-resolution display systems.

How the Company Operates

Daktronics uses a vertically integrated model that covers everything from product design and manufacturing to long-term maintenance. This approach allows the company to support customers through entire product lifecycles, including upgrades and replacement cycles.

The Scorecard

  • Net sales reached $838.7 million in fiscal 2026, up 10.9% year-over-year.
  • Operating income was $60.8 million in fiscal 2026, up 83.7% year-over-year.
  • Net income was $45.4 million in fiscal 2026, compared to a net loss of $10.1 million in fiscal 2025.
  • Product order backlog stood at $356.2 million as of May 2, 2026.

Bottom Line

Daktronics has evolved from a traditional scoreboard manufacturer into a provider of integrated digital communication systems. Its focus on vertical integration and diverse end markets helps maintain its position in the global display industry.

AI Generated • Jun 25, 2026

Industry

Electronic Equipment, Instruments and Components

Employees

2,693

CEO

Ramesh Jayaraman, MBA

Headquarters

Brookings, SD 57006, US

DAKT Financials

Key Financial Metrics (TTM)

Gross Margin

27.30%

Operating Margin

7.25%

Net Income Margin

5.41%

Return on Equity

15.49%

Return on Capital

19.08%

Return on Assets

8.18%

Earnings Yield

4.65%

Dividend Yield

0.00%

Payout Ratio

0.00%

Stock Overview

Market Cap

$952.66MMarket cap calculated using publicly traded shares outstanding only. Does not include unlisted, private, or dual-class non-traded shares. Implied market cap may vary.

Shares Outstanding

48.28M

Volume

495.66K

Avg. Volume

443.73K

Financials (TTM)

Gross Profit

$229.01M

Operating Income

$60.85M

EBITDA

$76.44M

Operating Cash Flow

$49.22M

Capital Expenditure

-$14.92M

Free Cash Flow

$34.30M

Cash & ST Invst.

$131.64M

Total Debt

$18.13M

Daktronics Performance Analysis

Daktronics annual revenue and year-over-year revenue growth by fiscal year
Fiscal yearPeriod endRevenueYoY growth
20232023-04-30USD 754,196,00023.4%
20242024-04-30USD 818,083,0008.5%
20252025-04-30USD 756,477,000-7.5%
20262026-04-30USD 838,706,00010.9%
Daktronics sequential (quarter-over-quarter) revenue growth by fiscal quarter
Fiscal quarterPeriod endQoQ growth
Q12025-08-0226.9%
Q22025-11-014.7%
Q32026-01-31-20.7%
Q42026-05-0214.7%
Daktronics annual diluted earnings per share and year-over-year EPS growth by fiscal year
Fiscal yearPeriod endDiluted EPSYoY growth
20232023-04-30USD 0.151040.5%
20242024-04-30USD 0.74397.9%
20252025-04-30USD -0.21N/A
20262026-04-30USD 0.92N/A
Daktronics sequential (quarter-over-quarter) diluted earnings per share growth by fiscal quarter
Fiscal quarterPeriod endQoQ growth
Q12025-08-02273.7%
Q22025-11-016.1%
Q32026-01-31-82.5%
Q42026-05-02178.2%

Revenue Growth Rate

Annual and quarterly growth comparison

Earnings Per Share Growth Rate

Annual and quarterly EPS growth comparison

Quarterly Performance

Name
Q4 2026YOY CHG

Revenue

$208.61M

+20.9%

Gross Profit

$58.48M

+35.5%

Gross Margin

28.03%

N/A

Market Cap

$952.66MMarket cap calculated using publicly traded shares outstanding only. Does not include unlisted, private, or dual-class non-traded shares. Implied market cap may vary.

N/A

Market Cap/Employee

$353.75K

N/A

Employees

2,693

N/A

Net Income

$8.42M

+189.3%

EBITDA

$14.94M

+273.8%

Quarterly Fundamentals

Name
Q4 2026YOY CHG

Total Cash

$131.64M

+3.2%

Total Debt

$18.13M

+7.9%

Accounts Receivable

$194.59M

+39.4%

Inventory

$110.47M

+4.4%

Long Term Debt

$13.74M

+3.7%

Short Term Debt

$4.39M

+23.8%

Return on Assets

8.18%

N/A

Return on Invested Capital

16.87%

N/A

Free Cash Flow

-$9.63M

-153.3%

Operating Cash Flow

-$5.11M

-122.3%

Other Investments to Explore

People Also Watch

Symbol / CompanyPricePrice Chg
BKSYBlackSky Technology Inc.
$20.61-6.10%
VTEXVtex
$4.50+2.97%
GILTGilat Satellite Networks Ltd.
$10.46-2.79%
SCSCScanSource, Inc.
$57.38+0.19%

Trending Stocks

Symbol / CompanyPricePrice Chg
SOFISoFi Technologies
$15.25-0.09%
INTCIntel
$81.88-0.05%
NVDANvidia
$190.01-0.04%
TQQQProShares Trust - ProShares UltraPro Qqq
$57.75-0.06%

Questions About DAKT

What is the current price of Daktronics?

Daktronics is trading at $19.59 per share.

What is the 52-week range for Daktronics?

Over the past 52 weeks, Daktronics has traded between $15.59 and $28.27.

How much debt does Daktronics have?

As of the most recent reporting period, Daktronics reported total debt of $18.13M.

How much cash does Daktronics have on hand?

Daktronics reported $131.64M in cash and cash equivalents in its most recent financial results.

What is Daktronics’s dividend yield?

Daktronics does not currently have a dividend yield.

Premium Investing Services

Invest better with The Motley Fool. Get stock recommendations, portfolio guidance, and more from The Motley Fool's premium services.