Accessibility Menu
Workday logo

Workday(NASDAQ) WDAY

Market Cap$47.19BMarket cap calculated using publicly traded shares outstanding only. Does not include unlisted, private, or dual-class non-traded shares. Implied market cap may vary.
Since IPO (2012)+302%
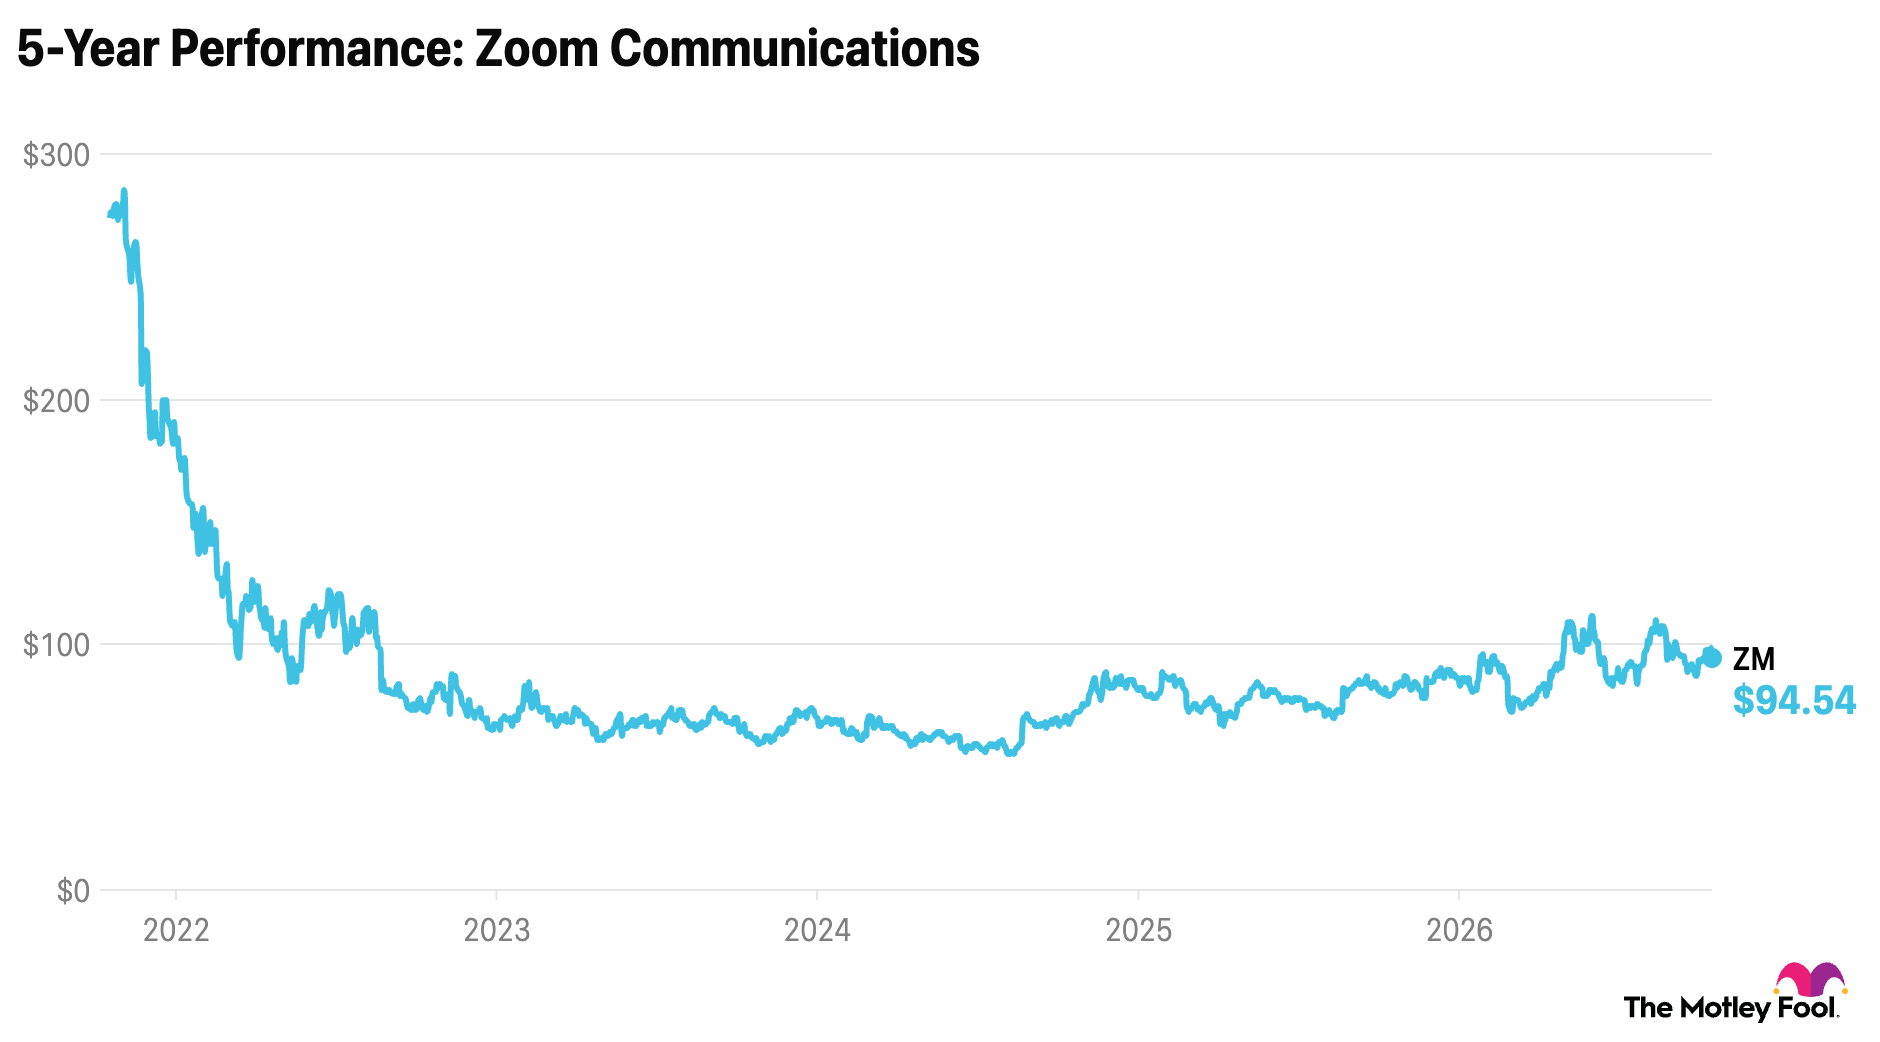
5 Year-30%
1 Year-15%
1 Month+15%
Premium Feature
Moneyball Superscore
73/100
$195.70
-5.42%
-11.22Today
After hours$196.00+$0.30 (+0.15%)
Workday last closing stock price
MetricPriceDate
Last closeUSD 195.792026-09-04
Workday stock price return by period
PeriodPrice returnPrice at period startPeriod start date
1 week-4.36%USD 204.722026-08-28
1 month+14.74%USD 170.642026-08-05
3 month+35.7%USD 144.282026-06-05
Year to date-8.84%USD 214.782025-12-31
1 year-15.29%USD 231.132025-09-04
3 year-20.8%USD 247.212023-09-05
5 year-29.51%USD 277.742021-09-03
Since inception+302.12%USD 48.692012-10-12

Workday Financials at a Glance

Market Cap

$47.19BMarket cap calculated using publicly traded shares outstanding only. Does not include unlisted, private, or dual-class non-traded shares. Implied market cap may vary.

Revenue (TTM)

$10.16B

Net Income (TTM)

$1.25B

EPS (TTM)

$4.93

P/E Ratio

39.73

Dividend

$0.00

Beta (Volatility)

1.13 (Average)

Price

$195.70

Volume

2,864,986

Open

$206.94

Previous Close

$195.79

Daily Range

$195.40 - $206.94

52-Week Range

$110.36 - $249.85

Estimated Earnings Date

Nov 24, 2026

WDAY: Motley Fool Moneyball Superscore

73

Our CEO Is Handing Members His Secret Weapon

It's called Motley Fool Moneyball, our new proprietary AI tool

We spent over half a million dollars in R&D to build a tool that makes stock research faster, sharper, and smarter. Our analysts use it every day, and now, you can too.

Get Access Now

About Workday

Workday helps big companies manage their employees and money. This software makes it easier for bosses to pay workers. It also tracks business spending and helps with planning.

Tools for Modern Offices

  • Human Capital Management: Software for hiring, payroll, and training; part of subscription services which were 93% of revenue for the six-month period ended July 31, 2026.
  • Financial Management: Tools for keeping accounting records and closing books; designed for chief financial officers (CFOs).
  • Spend Management: Platforms for managing supplier contracts and handling indirect business expenses.
  • Business Planning: Applications for strategizing and analyzing performance using artificial intelligence (AI) to create automated data stories.
  • Professional Services: Deployment and training help for clients setting up their systems.

Strategic Moves and Partnerships

  • Pioneered cloud-based human resources software in 2005 and grew to serve over 11,500 customers.
  • Invested in artificial intelligence to create new tools and automate routine business tasks.
  • Liquidated marketable debt securities to fund acquisition activities and share repurchases.
  • Expanded its partner ecosystem to help move consulting work to outside firms.

What Makes Workday Different?

Workday uses an artificial intelligence platform to connect human resources, finance, and technology data. This unified system allows large organizations to make faster decisions using real-time information from across the business.

The Numbers Behind the Growth

  • Total revenues were $5.2 billion for the six-month period ended July 31, 2026, up 13% year over year.
  • Operating margin improved to 12.5% in the first half of fiscal 2027, up from 6.3% a year earlier.
  • Subscription revenue backlog, which is contracted revenue not yet recognized, reached $27.4 billion on July 31, 2026.
  • The company maintained a gross revenue retention rate of approximately 97% as of July 31, 2026.
  • Workday held $3.4 billion in cash, cash equivalents, and marketable securities as of July 31, 2026.

The Big Picture

Workday has evolved from a human resources specialist to a provider of broad financial and operational software. Its focus on artificial intelligence and cloud services supports its role at the center of large business operations.

AI Generated • Aug 28, 2026

Industry

Software

Employees

21,000

CEO

Aneel Bhusri, MBA

Headquarters

Pleasanton, CA 94588, US

WDAY Financials

Key Financial Metrics (TTM)

Gross Margin

75.80%

Operating Margin

11.99%

Net Income Margin

12.32%

Return on Equity

16.78%

Return on Capital

8.81%

Return on Assets

7.89%

Earnings Yield

2.52%

Dividend Yield

0.00%

Payout Ratio

0.00%

Stock Overview

Market Cap

$47.19BMarket cap calculated using publicly traded shares outstanding only. Does not include unlisted, private, or dual-class non-traded shares. Implied market cap may vary.

Shares Outstanding

241.00M

Volume

2.86M

Avg. Volume

4.83M

Financials (TTM)

Gross Profit

$7.70B

Operating Income

$1.22B

EBITDA

$1.67B

Operating Cash Flow

$3.08B

Capital Expenditure

-$238.00M

Free Cash Flow

$2.84B

Cash & ST Invst.

$3.40B

Total Debt

$3.77B

Workday Performance Analysis

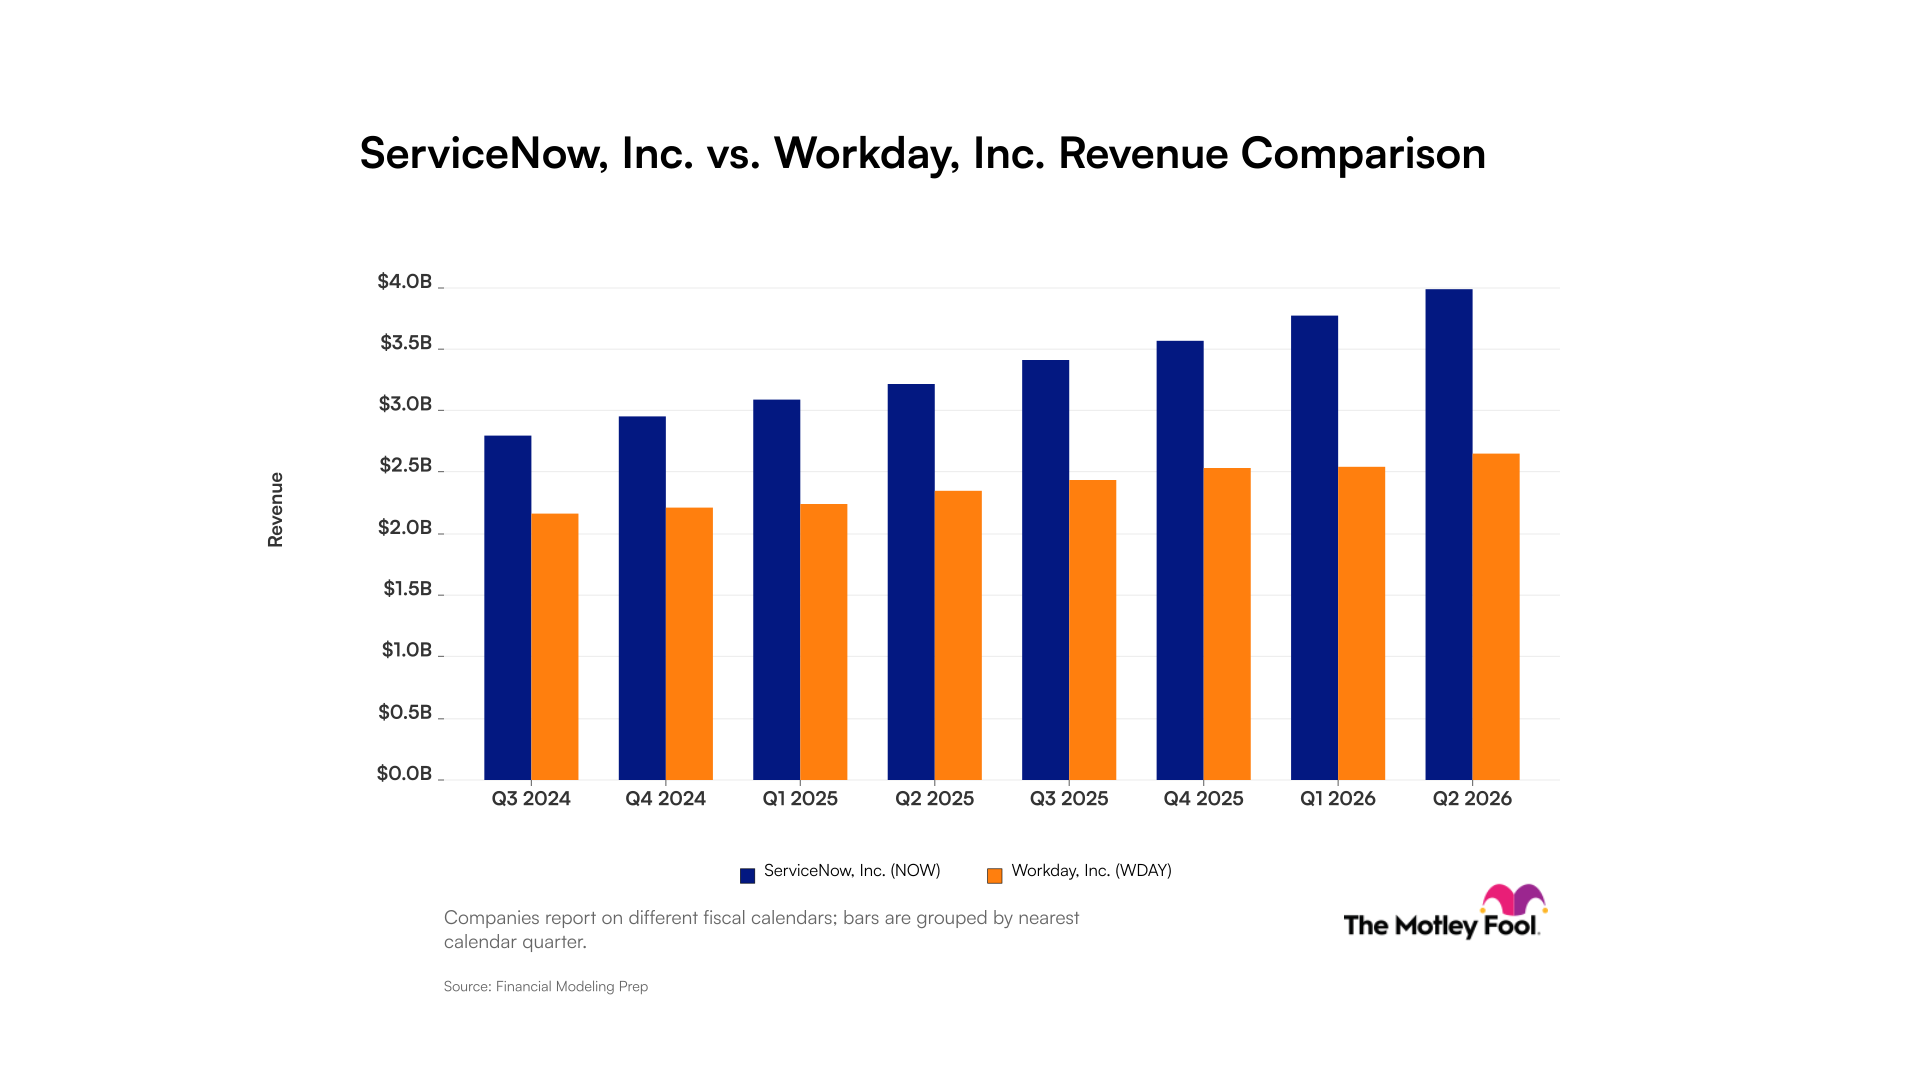
Workday annual revenue and year-over-year revenue growth by fiscal year
Fiscal yearPeriod endRevenueYoY growth
20232023-01-31USD 6,198,438,00020.4%
20242024-01-31USD 7,197,000,00016.1%
20252025-01-31USD 8,416,000,00016.9%
20262026-01-31USD 9,534,000,00013.3%
Workday sequential (quarter-over-quarter) revenue growth by fiscal quarter
Fiscal quarterPeriod endQoQ growth
Q32025-10-313.6%
Q42026-01-314.1%
Q12026-04-300.4%
Q22026-07-314.3%
Workday annual diluted earnings per share and year-over-year EPS growth by fiscal year
Fiscal yearPeriod endDiluted EPSYoY growth
20232023-01-31USD -1.44N/A
20242024-01-31USD 5.21N/A
20252025-01-31USD 1.95-62.5%
20262026-01-31USD 2.5832.3%
Workday sequential (quarter-over-quarter) diluted earnings per share growth by fiscal quarter
Fiscal quarterPeriod endQoQ growth
Q32025-10-3111.9%
Q42026-01-31-41.5%
Q12026-04-3058.2%
Q22026-07-31195.4%

Revenue Growth Rate

Annual and quarterly growth comparison

Earnings Per Share Growth Rate

Annual and quarterly EPS growth comparison

Quarterly Performance

Name
Q2 2027YOY CHG

Revenue

$2.65B

+12.9%

Gross Profit

$2.00B

+13.2%

Gross Margin

75.41%

N/A

Market Cap

$47.19BMarket cap calculated using publicly traded shares outstanding only. Does not include unlisted, private, or dual-class non-traded shares. Implied market cap may vary.

N/A

Market Cap/Employee

$2.26M

N/A

Employees

20,896

N/A

Net Income

$632.00M

+177.2%

EBITDA

$407.00M

-1.7%

Quarterly Fundamentals

Name
Q2 2027YOY CHG

Total Cash

$3.40B

-58.4%

Total Debt

$3.77B

-0.1%

Accounts Receivable

$1.92B

+14.8%

Inventory

$0.00

N/A

Long Term Debt

$2.64B

-27.9%

Short Term Debt

$1.13B

+926.4%

Return on Assets

7.89%

N/A

Return on Invested Capital

13.12%

N/A

Free Cash Flow

$460.00M

-21.8%

Operating Cash Flow

$520.00M

-15.6%

Other Investments to Explore

People Also Watch

Symbol / CompanyPricePrice Chg
MSTRStrategy Inc
$142.80-1.39%
INFYInfosys Limited
$11.70-3.23%
ADSKAutodesk, Inc.
$217.90-8.26%
CRWVCoreWeave, Inc. Class A Common Stock
$89.36+5.68%

Trending Stocks

Symbol / CompanyPricePrice Chg
TSLLDirexion Shares ETF Trust - Direxion Daily Tsla Bull 2x ETF
$9.15-0.12%
NVDANvidia
$230.36+0.01%
PATHUiPath
$15.19-0.17%
INTCIntel
$95.80+0.05%

Questions About WDAY

What is the current price of Workday?

Workday is trading at $195.79 per share.

What is the 52-week range for Workday?

Over the past 52 weeks, Workday has traded between $110.36 and $249.85.

How much debt does Workday have?

As of the most recent reporting period, Workday reported total debt of $3.77B.

How much cash does Workday have on hand?

Workday reported $668.00M in cash and cash equivalents in its most recent financial results.

What is Workday’s dividend yield?

Workday does not currently have a dividend yield.

Premium Investing Services

Invest better with The Motley Fool. Get stock recommendations, portfolio guidance, and more from The Motley Fool's premium services.