AbbVie logo

AbbVie(NYSE) ABBV

Market Cap$504.76BMarket cap calculated using publicly traded shares outstanding only. Does not include unlisted, private, or dual-class non-traded shares. Implied market cap may vary.
Since IPO (2012)+1,313%
5 Year+213%
1 Year+29%
1 Month+8%
Premium Feature
Moneyball Superscore
79/100
$285.58
+0.14%
+0.39Today
After hours$286.00+$0.42 (+0.15%)
AbbVie last closing stock price
MetricPriceDate
Last closeUSD 285.642026-10-23
AbbVie stock price return by period
PeriodPrice returnPrice at period startPeriod start date
1 week+0.08%USD 285.422026-10-16
1 month+8.42%USD 263.462026-09-23
3 month+10.81%USD 257.782026-07-24
Year to date+28.75%USD 221.852025-12-31
1 year+28.89%USD 221.622025-10-23
3 year+115.71%USD 132.422023-10-24
5 year+212.58%USD 91.382021-10-22
Since inception+1,312.53%USD 20.222012-12-10

AbbVie Financials at a Glance

Market Cap

$504.76BMarket cap calculated using publicly traded shares outstanding only. Does not include unlisted, private, or dual-class non-traded shares. Implied market cap may vary.

Revenue (TTM)

$64.39B

Net Income (TTM)

$6.31B

EPS (TTM)

$3.54

P/E Ratio

80.76

Dividend

$6.92

Beta (Volatility)

0.29 (Low)

Price

$285.58

Volume

4,631,883

Open

$284.58

Previous Close

$285.64

Daily Range

$282.30 - $286.77

52-Week Range

$190.75 - $291.40

Estimated Earnings Date

Oct 30, 2026

About AbbVie

AbbVie Inc. NYSE:ABBV makes medicines that help people with chronic skin conditions, digestive issues, and cancers. The company creates treatments to improve daily life for patients with autoimmune diseases and age-related health concerns. Its products help doctors manage complex illnesses through specialized pills, injections, and aesthetic procedures.

A Diverse Medicine Cabinet

  • Immunology: Portfolio includes Skyrizi for plaque psoriasis and Rinvoq for rheumatoid arthritis; these generated $9.99 billion and $4.64 billion in net sales respectively during the first six months of 2026.
  • Oncology and Hematology: Treatments like Venclexta and Imbruvica focus on blood cancers; Venclexta net sales reached $1.54 billion for the six-month period ended June 30, 2026.
  • Neuroscience: Offerings include Botox Therapeutic and Vraylar to treat migraines and psychiatric conditions; Botox Therapeutic net sales were $2.05 billion in the first half of 2026.
  • Aesthetics: Features the Juvederm collection and Botox Cosmetic for facial appearance; Botox Cosmetic net sales reached $1.40 billion for the six months ended June 30, 2026.
  • Other Specialties: Products like Creon and Linzess address digestive issues; Linzess net sales rose 42.1% to $578 million in the first half of 2026.

New Factories and Big Pledges

  • Announced plans in 2026 for a new pharmaceutical manufacturing campus in North Carolina using artificial intelligence and advanced laboratory technologies.
  • Expanded production capacity in Illinois to support upcoming neuroscience and obesity medications during 2026.
  • Acquired a device manufacturing facility in Arizona in July 2026 to enhance clinical and production capabilities.
  • Pledged $100 billion for research, development, and capital investments in the U.S. over the next 10 years starting in 2026.

How Innovation Drives Growth

The company manages a global distribution network, selling directly to wholesalers, government agencies, and healthcare providers from its own centers. Innovation remains a primary focus with approximately 90 compounds, devices, or indications currently in various stages of development.

Key Financial Facts

  • Worldwide net revenues reached $32.0 billion for the six months ended June 30, 2026, up 11% year over year.
  • Operating earnings were $10.4 billion during the first half of 2026.
  • Cash flows from operations rose to $7.3 billion for the six-month period ended June 30, 2026.
  • Market capitalization grew to $445.7 billion in the second quarter of 2026, up 35.5% year over year.
  • The company paid $6.2 billion in cash dividends to shareholders during the first six months of 2026.

The Evolution of a Giant

AbbVie has transitioned from a single-product focus to a diversified pharmaceutical leader with strong positions in immunology and neuroscience. Continuous investment in its drug pipeline and manufacturing infrastructure supports its long-term efforts to address evolving medical needs.

AI Generated • Aug 5, 2026

Industry

Biotechnology

Employees

57,000

CEO

Robert A. Michael, MBA, CPA

Headquarters

North Chicago, IL 60064-6400, US

ABBV Financials

Key Financial Metrics (TTM)

Gross Margin

71.48%

Operating Margin

29.32%

Net Income Margin

9.81%

Return on Equity

-136.50%

Return on Capital

30.53%

Return on Assets

4.67%

Earnings Yield

1.24%

Dividend Yield

2.42%

Payout Ratio

1.90%

Stock Overview

Market Cap

$504.76BMarket cap calculated using publicly traded shares outstanding only. Does not include unlisted, private, or dual-class non-traded shares. Implied market cap may vary.

Shares Outstanding

1.77B

Volume

4.63M

Avg. Volume

4.86M

Financials (TTM)

Gross Profit

$46.02B

Operating Income

$18.88B

EBITDA

$21.18B

Operating Cash Flow

$19.51B

Capital Expenditure

-$1.30B

Free Cash Flow

$18.21B

Cash & ST Invst.

$6.57B

Total Debt

$70.82B

AbbVie Performance Analysis

AbbVie annual revenue and year-over-year revenue growth by fiscal year
Fiscal yearPeriod endRevenueYoY growth
20222022-12-31USD 58,054,000,0003.3%
20232023-12-31USD 54,318,000,000-6.4%
20242024-12-31USD 56,334,000,0003.7%
20252025-12-31USD 61,160,000,0008.6%
AbbVie sequential (quarter-over-quarter) revenue growth by fiscal quarter
Fiscal quarterPeriod endQoQ growth
Q32025-09-302.3%
Q42025-12-315.3%
Q12026-03-31-9.7%
Q22026-06-3013.3%
AbbVie annual diluted earnings per share and year-over-year EPS growth by fiscal year
Fiscal yearPeriod endDiluted EPSYoY growth
20222022-12-31USD 6.632.7%
20232023-12-31USD 2.72-59.0%
20242024-12-31USD 2.39-12.1%
20252025-12-31USD 2.36-1.2%
AbbVie sequential (quarter-over-quarter) diluted earnings per share growth by fiscal quarter
Fiscal quarterPeriod endQoQ growth
Q32025-09-30-81.3%
Q42025-12-31927.2%
Q12026-03-31-61.8%
Q22026-06-30423.1%

Revenue Growth Rate

Annual and quarterly growth comparison

Earnings Per Share Growth Rate

Annual and quarterly EPS growth comparison

Quarterly Performance

Name
Q2 2026YOY CHG

Revenue

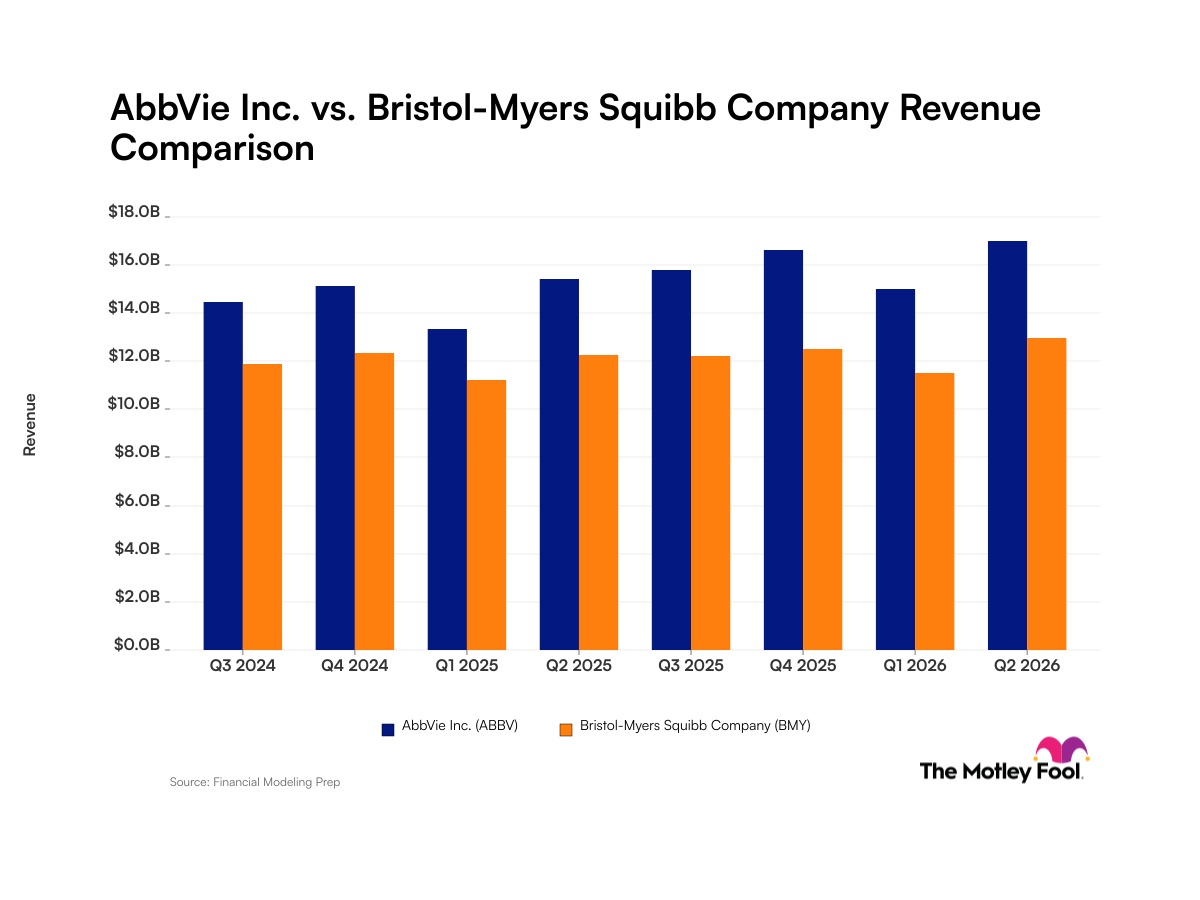
$16.99B

+10.2%

Gross Profit

$12.70B

+14.6%

Gross Margin

74.74%

N/A

Market Cap

$504.76BMarket cap calculated using publicly traded shares outstanding only. Does not include unlisted, private, or dual-class non-traded shares. Implied market cap may vary.

N/A

Market Cap/Employee

$8.86M

N/A

Employees

57,000

N/A

Net Income

$3.61B

+285.2%

EBITDA

$8.61B

+98.1%

Quarterly Fundamentals

Name
Q2 2026YOY CHG

Total Cash

$6.57B

+1.6%

Total Debt

$70.82B

+0.5%

Accounts Receivable

$13.82B

+9.4%

Inventory

$5.13B

+3.4%

Long Term Debt

$62.48B

-0.8%

Short Term Debt

$8.34B

+10.9%

Return on Assets

4.67%

N/A

Return on Invested Capital

20.19%

N/A

Free Cash Flow

$3.11B

-36.2%

Operating Cash Flow

$3.44B

-33.3%

Other Investments to Explore

People Also Watch

Symbol / CompanyPricePrice Chg
RHHBYRoche Holding AG
$61.17+2.60%
JNJJohnson & Johnson
$263.81-1.42%
MRKMerck & Co., Inc.
$145.27-1.34%
NVSNovartis AG
$151.12-3.30%

Trending Stocks

Symbol / CompanyPricePrice Chg
SPCXSpace Exploration Technologies
$147.49+1.89%
TAT&T
$20.93-7.96%
SOXLDirexion Shares ETF Trust - Direxion Daily Semiconductor Bull 3x ETF
$83.56+1.77%
NUNu Holdings
$15.16+2.92%

Questions About ABBV

What is the current price of AbbVie?

AbbVie is trading at $285.64 per share.

What is the 52-week range for AbbVie?

Over the past 52 weeks, AbbVie has traded between $190.75 and $291.40.

How much debt does AbbVie have?

As of the most recent reporting period, AbbVie reported total debt of $70.82B.

How much cash does AbbVie have on hand?

AbbVie reported $6.57B in cash and cash equivalents in its most recent financial results.

What is AbbVie’s dividend yield?

AbbVie currently has a dividend yield of 2.42%.

Premium Investing Services

Invest better with The Motley Fool. Get stock recommendations, portfolio guidance, and more from The Motley Fool's premium services.