Accessibility Menu
Murphy Oil logo

Murphy Oil(NYSE) MUR

Market Cap$5.35BMarket cap calculated using publicly traded shares outstanding only. Does not include unlisted, private, or dual-class non-traded shares. Implied market cap may vary.
Since IPO (1968)+12,718%
5 Year+111%
1 Year+55%
1 Month-2%
Premium Feature
Moneyball Superscore
55/100
$36.36
-2.57%
-0.96Today
Murphy Oil last closing stock price
MetricPriceDate
Last closeUSD 37.322026-09-03
Murphy Oil stock price return by period
PeriodPrice returnPrice at period startPeriod start date
1 week+3.81%USD 35.952026-08-27
1 month-1.77%USD 37.992026-08-04
3 month-2.5%USD 38.282026-06-05
Year to date+22.97%USD 30.352025-12-31
1 year+55.06%USD 24.072025-09-03
3 year-9.56%USD 41.272023-09-01
5 year+110.53%USD 17.732021-09-03
Since inception+12,717.76%USD 0.291968-01-02

Murphy Oil Financials at a Glance

Market Cap

$5.35BMarket cap calculated using publicly traded shares outstanding only. Does not include unlisted, private, or dual-class non-traded shares. Implied market cap may vary.

Revenue (TTM)

$3.02B

Net Income (TTM)

$294.05M

EPS (TTM)

$2.02

P/E Ratio

18.50

Dividend

$1.38

Beta (Volatility)

0.95 (Low)

Price

$36.36

Volume

809,333.63

Open

$37.09

Previous Close

$37.32

Daily Range

$36.15 - $37.20

52-Week Range

$24.49 - $43.34

Estimated Earnings Date

Nov 4, 2026

MUR: Motley Fool Moneyball Superscore

55

Our CEO Is Handing Members His Secret Weapon

It's called Motley Fool Moneyball, our new proprietary AI tool

We spent over half a million dollars in R&D to build a tool that makes stock research faster, sharper, and smarter. Our analysts use it every day, and now, you can too.

Get Access Now

About Murphy Oil

Murphy Oil Corporation finds and produces crude oil and natural gas. It helps provide the energy used to power cars and homes. The company sells these products to markets across North America.

Where the Energy Comes From

  • United States Oil: Crude oil production from the Gulf of Mexico and Eagle Ford Shale; accounted for $1,220.4 million of revenue in the first half of 2026.
  • Canada Natural Gas: Natural gas extraction primarily from the Tupper Montney area; contributed $130.7 million of revenue for the six months ended June 30, 2026.
  • United States Natural Gas: Gas produced alongside oil in onshore and offshore fields; provided $59.6 million of revenue during the first half of 2026.
  • Canada Oil: Production from offshore fields and onshore wells in Kaybob; generated $204.3 million of revenue in the first six months of 2026.

Reaching for New Frontiers

  • Expanded offshore capabilities by purchasing a floating production vessel in early 2025.
  • Refinanced debt in early 2026 by issuing $500 million in new notes to improve financial flexibility.
  • Advanced exploration in Côte d’Ivoire by making a discovery at the Bubale-1X well in 2026.
  • Progressed field development in Vietnam with first oil production anticipated in late 2026.

Technical and Global Strengths

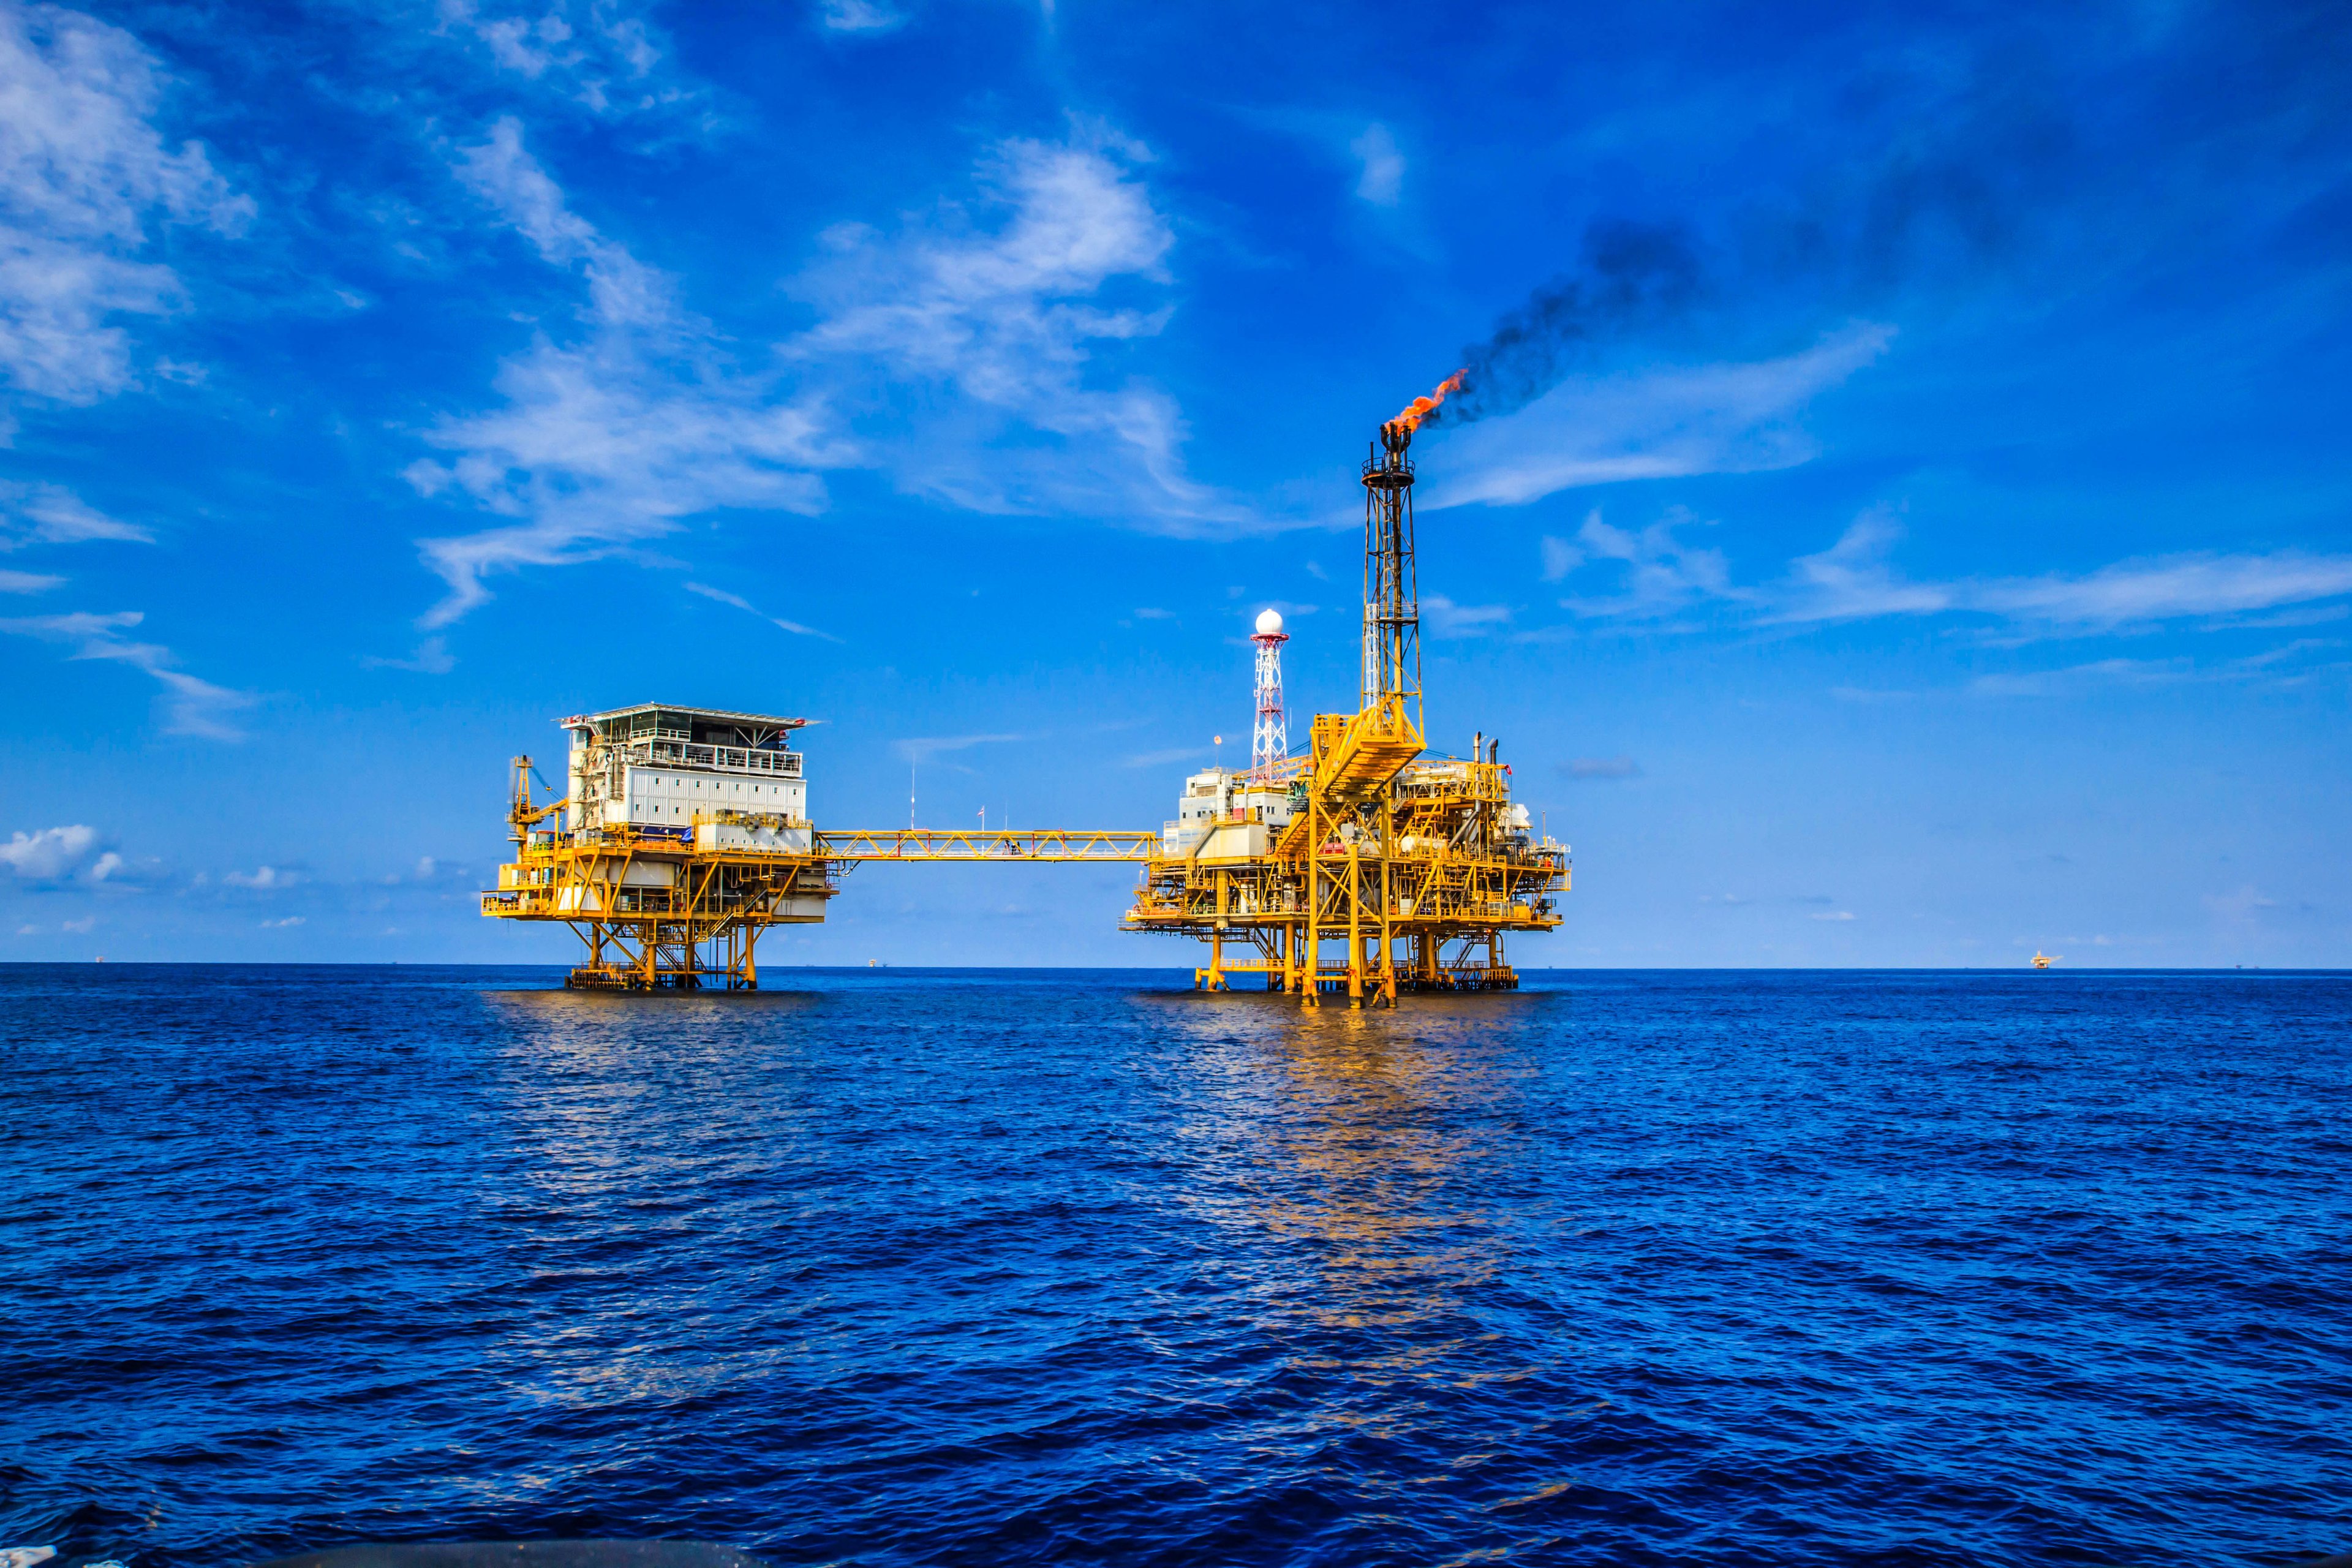
Murphy maintains a technical advantage by owning specialized processing infrastructure like floating production storage and offloading vessels. These mobile offshore facilities process and store oil directly at sea. The company also manages a global portfolio spanning from Texas shale to deepwater fields in Southeast Asia.

By the Numbers

  • Net income attributable to Murphy was $285.2 million for the six-month period ended June 30, 2026, up from $95.3 million for the same period in 2025.
  • Revenue from production reached $1,658.7 million in the first half of 2026, an increase of $302.9 million year over year.
  • Total energy production averaged 177,519 barrels of oil equivalent per day during the first six months of 2026.
  • Net cash from continuing operations reached $977.1 million for the six-month period ended June 30, 2026, up $318.4 million year over year.
  • Long-term debt was $1,547.9 million as of June 30, 2026, representing 22.7% of total capital employed.

The Bottom Line

Murphy has shifted focus toward higher-margin oil production in the Gulf of Mexico and Eagle Ford Shale. International offshore expansion aims to sustain long-term production and diversify its resource base.

AI Generated • Aug 6, 2026

Industry

Oil, Gas and Consumable Fuels

Sector

Energy

Employees

813

CEO

Eric M. Hambly

Headquarters

Houston, TX 77024, US

MUR Financials

Key Financial Metrics (TTM)

Gross Margin

82.33%

Operating Margin

18.42%

Net Income Margin

9.72%

Return on Equity

5.71%

Return on Capital

5.29%

Return on Assets

2.86%

Earnings Yield

5.41%

Dividend Yield

3.68%

Payout Ratio

65.68%

Stock Overview

Market Cap

$5.35BMarket cap calculated using publicly traded shares outstanding only. Does not include unlisted, private, or dual-class non-traded shares. Implied market cap may vary.

Shares Outstanding

143.38M

Volume

809.33K

Avg. Volume

1.78M

Financials (TTM)

Gross Profit

$2.49B

Operating Income

$556.87M

EBITDA

-$27.39B

Operating Cash Flow

$1.57B

Capital Expenditure

-$1.24B

Free Cash Flow

$329.79M

Cash & ST Invst.

$483.88M

Total Debt

$2.26B

Murphy Oil Performance Analysis

Murphy Oil annual revenue and year-over-year revenue growth by fiscal year
Fiscal yearPeriod endRevenueYoY growth
20222022-12-31USD 4,220,140,00050.7%
20232023-12-31USD 3,448,854,000-18.3%
20242024-12-31USD 3,018,598,000-12.5%
20252025-12-31USD 2,689,845,000-10.9%
Murphy Oil sequential (quarter-over-quarter) revenue growth by fiscal quarter
Fiscal quarterPeriod endQoQ growth
Q32025-09-305.5%
Q42025-12-31-10.9%
Q12026-03-3114.1%
Q22026-06-3026.8%
Murphy Oil annual diluted earnings per share and year-over-year EPS growth by fiscal year
Fiscal yearPeriod endDiluted EPSYoY growth
20222022-12-31USD 6.13N/A
20232023-12-31USD 4.22-31.1%
20242024-12-31USD 2.70-36.2%
20252025-12-31USD 0.72-73.2%
Murphy Oil sequential (quarter-over-quarter) diluted earnings per share growth by fiscal quarter
Fiscal quarterPeriod endQoQ growth
Q32025-09-30-113.0%
Q42025-12-31488.5%
Q12026-03-31357.9%
Q22026-06-30329.7%

Revenue Growth Rate

Annual and quarterly growth comparison

Earnings Per Share Growth Rate

Annual and quarterly EPS growth comparison

Quarterly Performance

Name
Q2 2026YOY CHG

Revenue

$928.31M

+35.9%

Gross Profit

$724.32M

+370.0%

Gross Margin

78.03%

N/A

Market Cap

$5.35BMarket cap calculated using publicly traded shares outstanding only. Does not include unlisted, private, or dual-class non-traded shares. Implied market cap may vary.

N/A

Market Cap/Employee

$6.58M

N/A

Employees

813

N/A

Net Income

$232.18M

+942.1%

EBITDA

$605.53M

+89.7%

Quarterly Fundamentals

Name
Q2 2026YOY CHG

Total Cash

$483.88M

+27.5%

Total Debt

$2.26B

+4.6%

Accounts Receivable

$443.12M

+61.7%

Inventory

$62.01M

-0.8%

Long Term Debt

$1.98B

+0.6%

Short Term Debt

$280.16M

+46.2%

Return on Assets

2.86%

N/A

Return on Invested Capital

6.14%

N/A

Free Cash Flow

$200.27M

+313.7%

Operating Cash Flow

$655.91M

+83.2%

Other Investments to Explore

People Also Watch

Symbol / CompanyPricePrice Chg
AROCArchrock, Inc.
$32.52-0.14%
CRCCalifornia Resources Corp
$54.34+1.72%
ENPHEnphase Energy, Inc.
$36.27-0.11%
VALValaris Limited
$86.13-4.02%

Trending Stocks

Symbol / CompanyPricePrice Chg
TSLLDirexion Shares ETF Trust - Direxion Daily Tsla Bull 2x ETF
$9.18-0.12%
NVDANvidia
$229.97+0.01%
PATHUiPath
$15.31-0.16%
INTCIntel
$94.99+0.04%

Questions About MUR

What is the current price of Murphy Oil?

Murphy Oil is trading at $36.34 per share.

What is the 52-week range for Murphy Oil?

Over the past 52 weeks, Murphy Oil has traded between $24.49 and $43.34.

How much debt does Murphy Oil have?

As of the most recent reporting period, Murphy Oil reported total debt of $2.26B.

How much cash does Murphy Oil have on hand?

Murphy Oil reported $483.88M in cash and cash equivalents in its most recent financial results.

What is Murphy Oil’s dividend yield?

Murphy Oil currently has a dividend yield of 3.68%.

Premium Investing Services

Invest better with The Motley Fool. Get stock recommendations, portfolio guidance, and more from The Motley Fool's premium services.