For investors seeking exposure to the broad U.S. stock markets, the Vanguard Russell 1000 Growth ETF (VONG +0.44%) and the Vanguard S&P 500 Growth ETF (VOOG +0.53%) stand out as two low-cost, index-tracking ETFs from Vanguard. Both ETFs track large-cap U.S. growth stocks, but differ in their index construction, sector tilts, and historical returns.
VONG and VOOG target the high-growth segment of the U.S. equity market, but VONG follows the Russell 1000 Growth Index, while VOOG tracks the S&P 500 Growth Index. The matchup below explores which ETF may appeal to you based on your preferences for cost, performance, and portfolio makeup.
Snapshot (cost & size)
| Metric | VONG | VOOG |
|---|---|---|
| Issuer | Vanguard | Vanguard |
| Expense ratio | 0.07% | 0.07% |
| 1-yr total return (as of Dec. 31, 2025) | 18.5% | 22.1% |
| Dividend yield | 0.43% | 0.54% |
| Beta | 1.16 | 1.08 |
| AUM | $44.6 billion | $21.6 billion |
Beta measures price volatility relative to the S&P 500; beta is calculated from five-year weekly returns. The 1-yr return represents total return over the trailing 12 months.
Both funds are equally affordable, with an expense ratio of 0.07%, and each distributes a modest 0.5% dividend yield, making cost and yield a wash between the two choices.
Performance & risk comparison
| Metric | VONG | VOOG |
|---|---|---|
| Max drawdown (5 y) | (32.7%) | (32.7%) |
| Growth of $1,000 over 5 years | $1,987 | $1,961 |
What's inside the ETF portfolios
The Vanguard S&P 500 Growth ETF tracks the S&P 500 Growth Index, comprising large-cap growth stocks with 217 holdings. It has a heavy technology tilt (41.4%), followed by communication services (16.75%) and consumer discretionary (11.86%). Its top positions are Nvidia (NVDA 0.47%) at 13.51%, Apple (AAPL 1.81%) at 5.96%, and Microsoft (MSFT +1.20%) at 5.95%. VOOG has a long history with more than 15 years in the market, and does not include any structural quirks.
The Vanguard Russell 1000 Growth ETF mirrors the Russell 1000 Growth Index, which focuses on large-cap growth stocks in the U.S. but holds a broader basket of 391 stocks. Its sector allocation is also tech-heavy (61.8%), followed by consumer discretionary (16.8%) and industrials (8.1%). Unlike VOOG, communications is only a tiny fraction of holdings. VONG's largest positions are similar to VOOGs and include Nvidia (NVDA 0.47%) at 12.22%, Apple (AAPL 1.81%) at 12.04%, and Microsoft (MSFT +1.20%) at 10.79%.
For more guidance on ETF investing, check out the full guide at this link.
What this means for investors
The Vanguard S&P 500 Growth ETF and the Vanguard Russell 1000 Growth ETF are both low-cost Vanguard powerhouses giving investors exposure to U.S. growth stocks with a large market capitalization. Growth stocks are typically companies that grow their earnings at a faster rate than the industry or market average, and therefore tend to deliver handsome returns in the long term. The focus on large-cap growth stocks further provides a safety net as large-cap stocks are often established, blue-chip companies with a strong clout in their respective industries, reliable business models, and growth catalysts.
VOOG, however, only invests in S&P 500 companies while VONG draws from the Russell 1000, which provides exposure to a larger group of companies that may not necessarily be a part of the S&P 500 index.
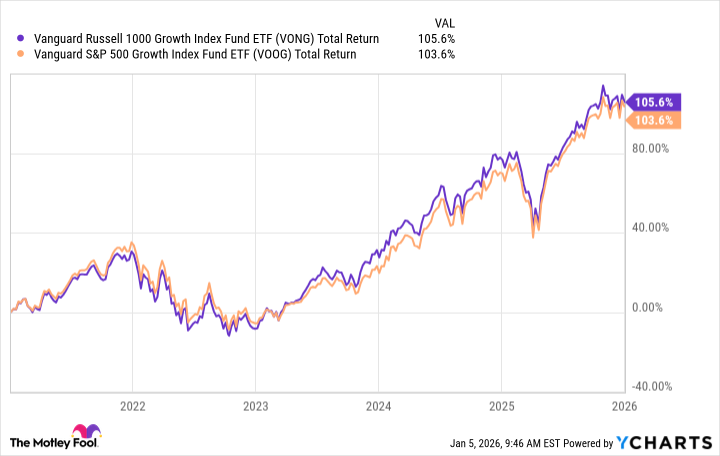
VONG Total Return Level data by YCharts
Growth investors may choose either of the two ETFs, as there's a lot of overlap in their largest holdings, and both are heavily tech-tilted funds. Cost is not a criterion here because both funds charge the expense ratio, and the choice largely boils down to the extent of exposure to growth stocks you seek and sector preferences, if any.
Both ETFs invest in the best-of-the-best large-cap growth stocks, but VONG gives you maximum growth exposure albeit with a significantly higher exposure to the tech sector. This may also make the ETF slightly more volatile, as reflected by its higher beta compared to VOOG. Splitting your investment between the two ETFs is a great idea to get the most out of growth stocks.
Glossary
ETF: Exchange-traded fund; a pooled investment fund traded on stock exchanges, similar to a stock.
Expense ratio: The annual fee, as a percentage of assets, that a fund charges its shareholders.
Dividend yield: The annual dividends paid by a fund, expressed as a percentage of its current price.
Total return: The investment's price change plus all dividends and distributions, assuming those payouts are reinvested.
Index-tracking: A strategy where a fund aims to replicate the performance of a specific market index.
Russell 1000 Growth Index: A stock market index measuring the performance of large-cap U.S. growth stocks.
S&P 500 Growth Index: An index representing the growth-oriented stocks among the S&P 500 companies.
Beta: A measure of a fund's volatility compared to the overall market, typically the S&P 500.
AUM: Assets under management; the total market value of assets a fund manages.
Max drawdown: The largest observed percentage drop from a fund's peak value to its lowest point over a period.
Sector allocation: The distribution of a fund's investments across different industry sectors.
Consumer cyclicals: Companies whose business performance is closely tied to the economic cycle, such as retailers and automakers.