This has been an exceptionally busy month for Berkshire Hathaway (BRK.A 0.08%)(BRK.B 0.21%) shareholders, as well as investors who closely monitor the thoughts and trading activity of billionaire CEO Warren Buffett.
On May 3, Berkshire Hathaway held its annual meeting in front of approximately 40,000 attendees in Omaha, as well as released its first-quarter operating results. While Berkshire's annual meetings are known for their nuggets of investing wisdom from the Oracle of Omaha and his top advisors (which until his November 2023 passing had included his right-hand man, Charlie Munger), the bombshell takeaway from May 3 was the announcement that Buffett would step down as CEO and cede way to predetermined successor Greg Abel by the end of 2025.
But what if I told you there's an even bigger and more meaningful story playing out at Berkshire Hathaway?

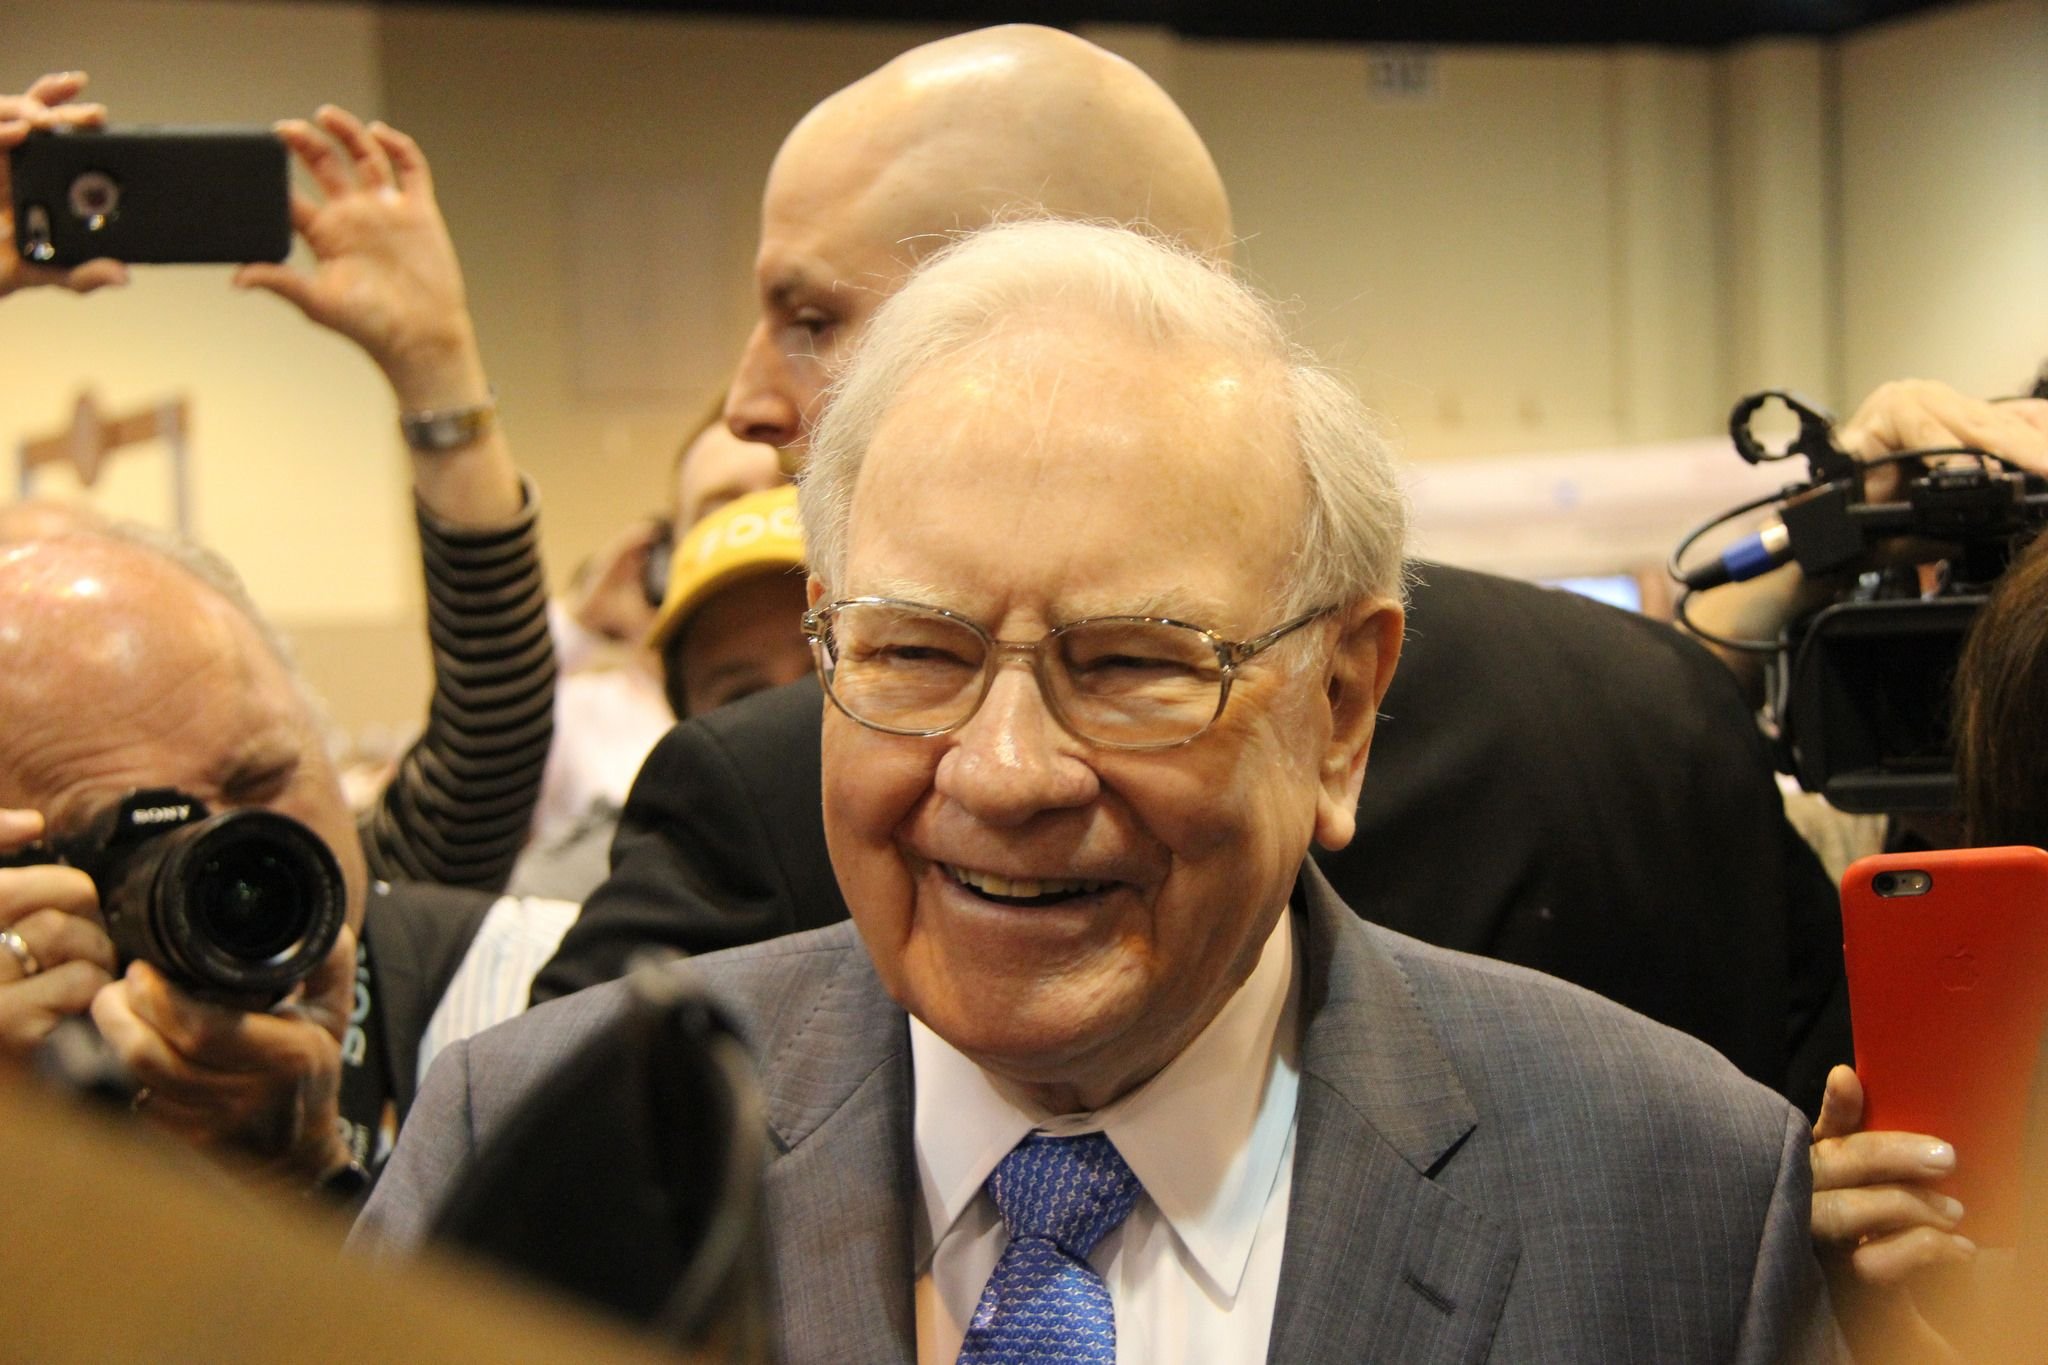
Berkshire Hathaway CEO Warren Buffett. Image source: The Motley Fool.
Warren Buffett has dropped a $174 billion bombshell on Wall Street
The reason Warren Buffett attracts tens of thousands of investors to Berkshire's annual meeting each year is simple: he outperforms. Since taking over as CEO six decades ago, he's overseen a cumulative return in this company's Class A shares (BRK.A) of 6,230,236%, as of the closing bell on May 12. For context, the benchmark S&P 500 (^GSPC 0.74%) has returned about 39,000%, including dividends paid, over the same 60-year timeline.
Lengthy books have been written discussing the characteristics that have made Buffett a successful investor. Some of these traits include investing for the long-term, seeking out companies with sustainable competitive advantages, and favoring businesses that have hearty capital-return programs (dividends and/or share buybacks).
The underlying basis of Warren Buffett's success has been a steady diet of putting Berkshire Hathaway's capital to work via the company's investment portfolio or through acquisitions.

NYSE: BRK.B
Key Data Points
But there's just one problem: Buffett hasn't been a net buyer of stocks for quite some time.
Each quarter, Berkshire Hathaway's cash flow statement breaks down precisely how much was spent buying stocks ("purchases of equity securities") and how much Buffett collectively sold ("sales of equity securities"). For 10 consecutive quarters (Oct. 1, 2022 – March 31, 2025), Buffett has sold more stocks than he's purchased.
Including the $1.494 billion in net-selling activity from the first quarter of 2025, Berkshire's chief has sold $174.4 billion more in stocks than he's purchased over a span of 30 months. This isn't what investors want to see from a storied money manager whose entire legend has been built around investing in other businesses.
The Oracle of Omaha serves up a bitter reality for those willing to listen
On the surface, nothing has seemingly changed. Buffett, along with his investment lieutenants Todd Combs and Ted Weschler, strongly believe in the U.S. economy and stock market over the long run. In fact, the Oracle of Omaha has cautioned investors on more than one occasion to not bet against America.
However, Berkshire Hathaway's cash flow statements don't lie. He's been a net seller of stocks for 10 straight quarters, and there's only one explanation behind it: valuation.

Image source: Getty Images.
With decades of Buffett's trading activity publicly available, two unwavering realities stand out:
- He's an unabashed optimist who strongly believes in the U.S. economy and American businesses; and
- He's a staunch value investor who isn't willing to chase any stock higher if its valuation doesn't make sense.
There's, arguably, not a company that's nearer and dearer to Buffett's heart than his own. After Berkshire Hathaway's board amended the rules governing share repurchases in mid-July 2018, Buffett bought back shares of his own company's stock for 24 consecutive quarters. The aggregate amount he spent repurchasing Berkshire Hathaway stock -- almost $78 billion -- is more than was spent (on a cost basis) for his company's respective stakes in Apple, Bank of America, American Express, Coca-Cola, Chevron, and Occidental Petroleum, combined.
But Berkshire's head honcho hasn't authorized a red cent in buybacks for nine consecutive months (July 1, 2024 – March 31, 2025). The reason? Berkshire Hathaway's stock has been vacillating between a 60% and 80% premium to its listed book value, which is notably higher than the 30% to 60% premium it gyrated between from mid-2018 to mid-2024. Buffett is an unwavering value investor, and not even shares of his own company meet his stringent definition of "value" any longer.
The bitter reality for investors is that the stocks, in general, remain historically pricey.
For example, the S&P 500's Shiller price-to-earnings (P/E) Ratio, which is also known as the cyclically adjusted P/E Ratio (CAPE Ratio), peaked at a multiple of 38.89 during the current bull market cycle in December. This figure is more than double the average Shiller P/E multiple of 17.24, when back-tested to January 1871.

S&P 500 Shiller CAPE Ratio data by YCharts.
While President Donald Trump's tariff-induced stock market correction in the benchmark S&P 500 did, very briefly, relieve the Shiller P/E from its third-priciest valuation during a continuous bull market in 154 years, the bounce-back rally in recent weeks has pushed the Shiller P/E to nearly 36, once again.
Spanning more than 150 years, there have been only six instances, including the present, where the CAPE Ratio surpassed 30 for at least a two-month period. Following the previous five occurrences, the S&P 500 went on to lose 20% or more of its value. In other words, premium valuations have consistently proven unsustainable over the long run and given way to sizable downside in equities.
It's a similar story for the "Buffett Indicator," which is a valuation tool that Warren Buffett referred to as, "probably the best single measure of where valuations stand at any given moment," while giving an interview with Fortune magazine in 2001. The Buffett Indicator is a measure of the total market cap of U.S. stocks divided by U.S. gross domestic product (GDP).
Since 1970, the average market cap-to-GDP ratio has been roughly 85% (i.e., the total value of all publicly traded companies equals 85% of U.S. GDP). In mid-February, when the S&P 500 hit its all-time closing high, the Buffett Indicator peaked at more than 205%. As of the closing bell on May 12, it was nearing 195%.
The unpleasant truth for investors that stems from Buffett's $174 billion warning to Wall Street is that stocks remain historically pricey and value is hard to come by. Either the S&P 500 has a bear market in its future (as has previously been predicted by Shiller P/E readings north of 30), or future stock returns will be modest, at best, as corporate earnings and U.S. GDP growth catch up with premium stock valuations.