Investors have a lot of ways to grow their wealth, including acquiring real estate, purchasing Treasury or corporate bonds, and buying commodities like gold, silver, and oil. While all of these investment channels have increased the nominal wealth of investors over the long run, none has held a candle to the annualized return of stocks over the last century.
Although Wall Street's major stocks indexes -- the Dow Jones Industrial Average (^DJI 0.17%), S&P 500 (^GSPC 0.06%), and Nasdaq Composite (^IXIC 0.06%) -- have a knack for increasing in value over long periods, they can deliver roller-coaster volatility over shorter timelines.
For example, shortly after the benchmark S&P 500 hit its record-closing high on Feb. 19, the Dow Jones and S&P 500 would fall into correction territory within a matter of weeks. Volatility was even more pronounced in the growth-fueled Nasdaq Composite, which officially fell into a bear market in April.

Image source: Getty Images.
But volatility tends to beget opportunity on Wall Street. While the S&P 500 was enduring its fifth-steepest two-day percentage decline in early April, it was, in hindsight, setting up for a unique event that's historically had an exemplary track record of forecasting future stock returns.
Wall Street's volatility is far from over
Although the stock market's premier measure of volatility, the CBOE Volatility Index, has plummeted from its recent high at the fastest pace in history, there's little reason to believe the catalysts that whipsawed Wall Street in March and April are going away anytime soon.
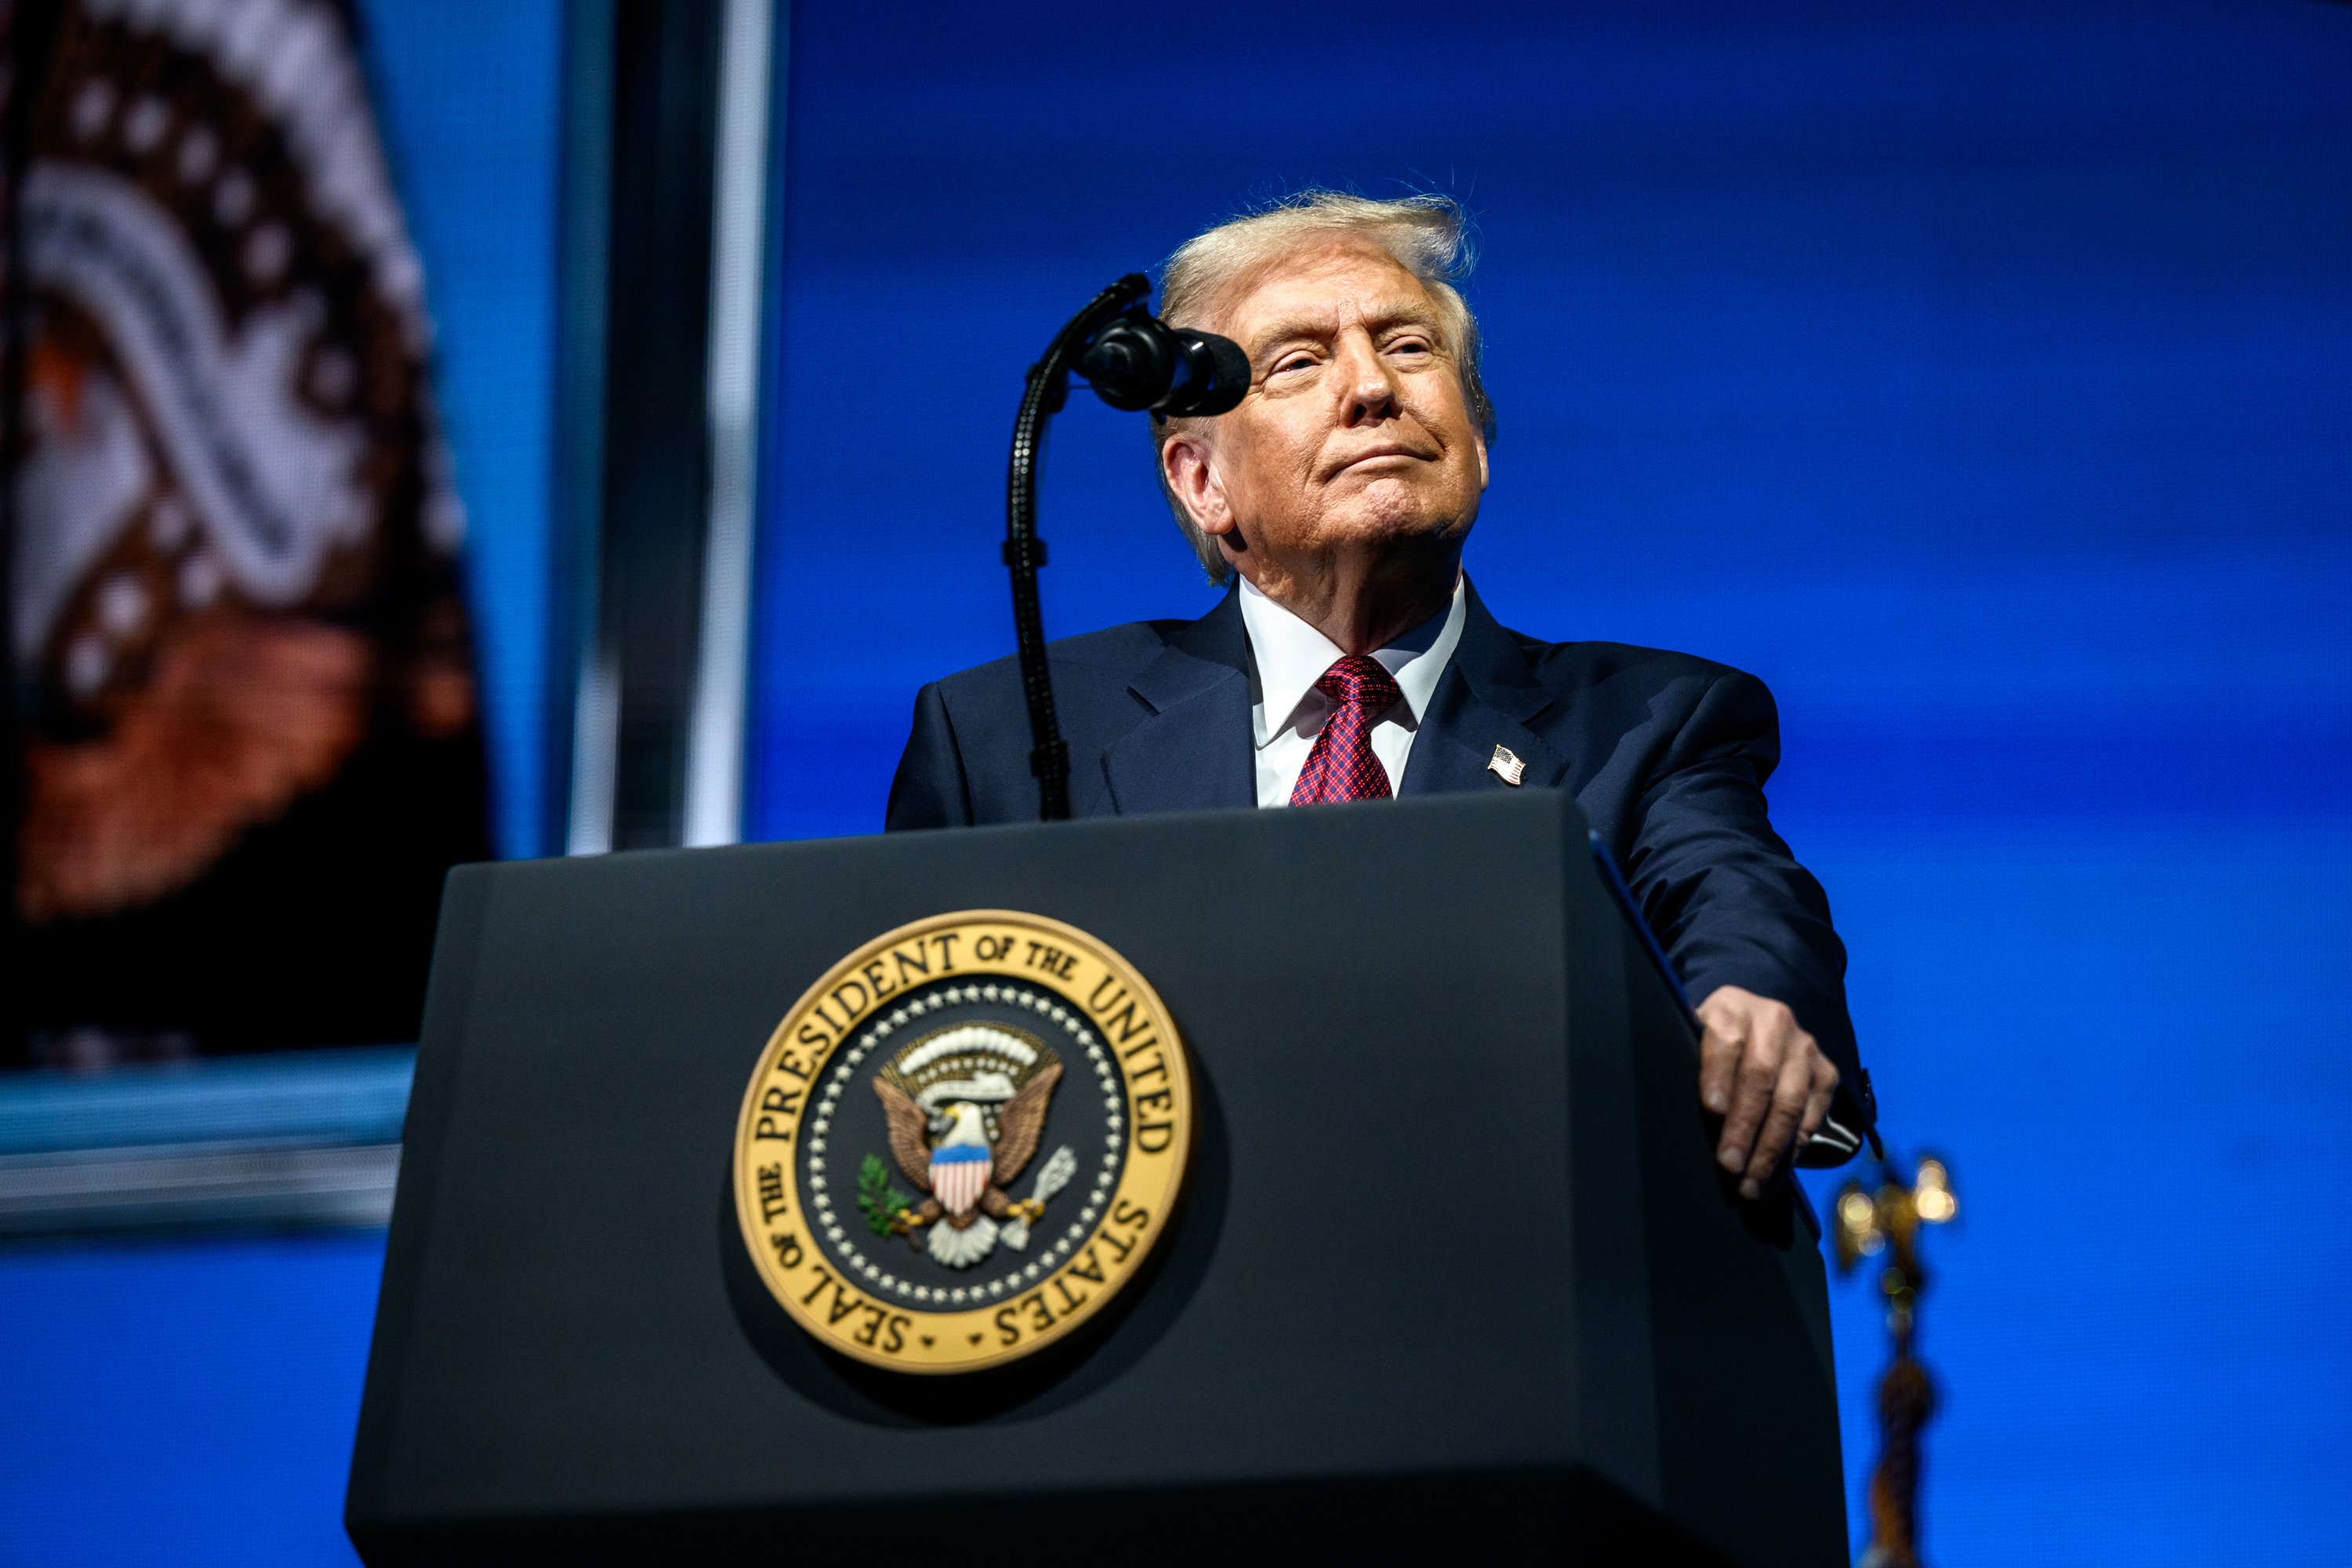
For example, the aforementioned two-day swoon in the S&P 500 that cost the index 10.5% of its value was precipitated by President Donald Trump introducing his tariff and trade policy. Following the close of trading on April 2, the president announced a 10% sweeping global tariff along with higher "reciprocal tariff rates" for a few dozen countries that have historically maintained adverse trade imbalances with America.
To be upfront, the terms of this initial unveiling have changed quite a bit. On April 9, Trump placed a 90-day pause of all reciprocal tariffs save for China. Roughly a month later, the U.S. and China agreed to reduce many of their reciprocal tariffs for a period of 90 days. Nevertheless, Wall Street craves consistency and predictability, and it's getting nothing of the sort from the current administration.
The bigger concern is what might happen if Trump's tariff and trade policy sticks over a longer period (e.g., during a majority of his four-year term). Tariffs run the risk of worsening trade relations (even with allies), as well as increasing the prevailing rate of inflation domestically. While some businesses may choose to eat some or all of the tariff costs, these expenses can also get passed along to consumers.

10 Year Treasury Rate data by YCharts.
There's also been concern about how the bond market has responded in recent months. Although the Federal Reserve is currently in a drawn-out rate-easing cycle, and that would normally lead to Treasury bond yields declining or flattening out, the closely watched 10-year Treasury yield has been climbing.
The 10-year Treasury yield is typically viewed as the benchmark for long-term interest rates. If the 10-year yield is climbing, it means mortgage rates are likely to rise, as well. Further, it signals an expectation that the prevailing rate of inflation is going to pick back up, which is a worrisome scenario with the Fed still early in its rate-easing cycle. Long story short, there are some clear concerns about the health of the U.S. economy.
The other troublesome factor that isn't going away anytime soon is Wall Street's nosebleed valuation premium. Even taking into consideration that "value" is a subjective term that's going to be different for every investor, the S&P 500's Shiller price-to-earnings (P/E) Ratio (also known as the cyclically adjusted P/E Ratio, or CAPE Ratio) leaves no wiggle room -- we're witnessing one of the most-expensive stock markets in history.
In December, the Shiller P/E Ratio closed at a peak of 38.89, which represents the third-highest multiple in a continuous bull market dating back to January 1871. With the Shiller P/E recently topping 37, the historic priciness of stocks is likely to keep things volatile.

Image source: Getty Images.
An extremely rare event for the S&P 500 signals stocks may be off to the races
But a little over one week ago, Wall Street's benchmark stock index, the S&P 500, did something that's only been recorded six times over the last 75 years. Historically speaking, when this event has occurred, it's been a surefire bull signal for investors.
As you've probably noticed, stocks have bounced back in a meaningful way since the initial tariff-related swoon that took the Dow Jones Industrial Average, S&P 500, and Nasdaq Composite to their lows for the year on April 8. However, you might not realize just how strong this rally in equities has been.
Over a two-month period, ended June 9, 2025, the S&P 500 gained 20.8%. This tied for the fifth-biggest two-month percentage gain in the S&P 500 since 1950 and marked only the sixth time in 75 years that the index had gained at least 20% over a two-month time frame.
What's worthwhile is examining how the S&P 500 performed in various periods following these extremely rare instances where it logged a 20%-plus percentage gain over two months. Based on data compiled by Carson Group's Chief Market Strategist Ryan Detrick, the S&P 500 was higher at every single time interval (one, three, six, and 12 months) following a two-month advance of at least 20%.
Crazy to think two months ago how things were, but the good news is we are about to wrap up one of the best two-month periods in history.
-- Ryan Detrick, CMT (@RyanDetrick) June 9, 2025
Previous times that gained >20%? Never lower 1-, 3-, 6-, or 12-months later and up more than 30% on average a year later.
🐂🐂🐂💪💪💪 pic.twitter.com/4ViDGlIiLC
What's even more impressive than this correlation (thus far) having a 100% success rate of forecasting future upside is just how far outside the historical norm the benchmark index climbed over the next 12 months following these unique events. Whereas the S&P 500 has averaged a 9.2% annual return since 1950, it's delivered an average (I repeat, average) return of 30.8% following the five prior instances where it achieved a 20%-plus two-month return. Based solely on this correlation, it would appear stocks are being given a green light to skyrocket higher.
This is a good time to mention that just because something has worked in the past via a correlation, it doesn't guarantee it'll work in the future. Nevertheless, a 100% correlation rate with an average 12-month return of 30.8% would appear to offer a better than 50-50 chance of the bulls being right.
What Ryan Detrick's data set also demonstrates is that emotion-driven volatility and fear tend to offer great investment opportunities on Wall Street. Even though we're never going to know ahead of time precisely when these elevator-down moves will begin, how long they'll last, or how steep the ultimate decline will be, we do have copious statistical data that shows just how disproportionate bull and bear markets actually are.
Two years ago, the researchers at Bespoke Investment Group published a data set on X that openly compared and calculated the calendar-day length of every bull and bear market for the S&P 500 dating back to the start of the Great Depression in September 1929. Whereas the typical bear market resolved in 286 calendar days (about 9.5 months), the average bull market stuck around for 1,011 calendar days (approximately two years and nine months).
Wagering on the stock market to bounce back after emotion-driven moves lower has historically been a genius move.