Investors have no shortage of ways to grow their wealth over time. They can buy real estate, put their money to work in fixed-income assets like certificates of deposit or U.S. Treasury bonds, and can purchase commodities like oil, gold, and silver. However, no other asset class has come within a stone's throw of stocks over the last century on an annualized return basis.
But just because stocks are the premier asset class to own over multiple decades, it doesn't mean Wall Street's major indexes move up in a straight line.
The iconic Dow Jones Industrial Average (^DJI +0.53%), broad-based S&P 500 (^GSPC +0.70%), and growth-propelled Nasdaq Composite (^IXIC +1.00%), have endured their fair share of corrections, bear markets, and even crashes since their respective inceptions. In just a one-week period in early April, we observed the fifth-largest two-day percentage drop for the S&P 500 dating back to 1950, as well as the largest single-day nominal point gain for the Dow Jones, S&P 500, and Nasdaq Composite since their respective inceptions.

Image source: Getty Images.
When the market gyrates, it's perfectly normal for investors to dig for clues as to which direction stocks will move next. Even though no metric or predictive tool can guarantee what's to come, it's hard to overlook the statistical correlations that some data points and events have offered over the years.
One forecasting tool, which occurs infrequently but has a historically flawless track record of correlating with big moves on Wall Street, has a crystal-clear message for investors: Prepare for eventual downside.
More than 150 years of history points to trouble ahead for the Dow, S&P 500, and Nasdaq
To preface the following discussion, there's always a data point, correlative event, or X factor threatening to cause the Dow Jones Industrial Average, S&P 500, and Nasdaq Composite to plunge. Despite this, these indexes have motored higher over longer periods.
But based on one value-focused forecasting measure, the good times are, eventually, set to end for Wall Street's major stock indexes.
When investors think of the word "value," the price-to-earnings (P/E) ratio probably comes to mind. This quick-and-easy valuation measure can be arrived at by taking a company's share price and dividing it by its trailing-12-month earnings per share (EPS). The traditional P/E ratio works great for mature businesses, but it's not always a reliable valuation tool for growth stocks or during recessions.
The valuation tool that offers a flawless forecasting track record when back-tested more than 150 years is the S&P 500's Shiller P/E Ratio. You'll occasionally see the Shiller P/E referred to as the cyclically adjusted P/E Ratio, or CAPE Ratio.
Unlike the traditional P/E ratio, the Shiller P/E is based on average inflation-adjusted EPS over the trailing decade. Encompassing 10 years' worth of earnings history ensures that recessions don't adversely skew the results.
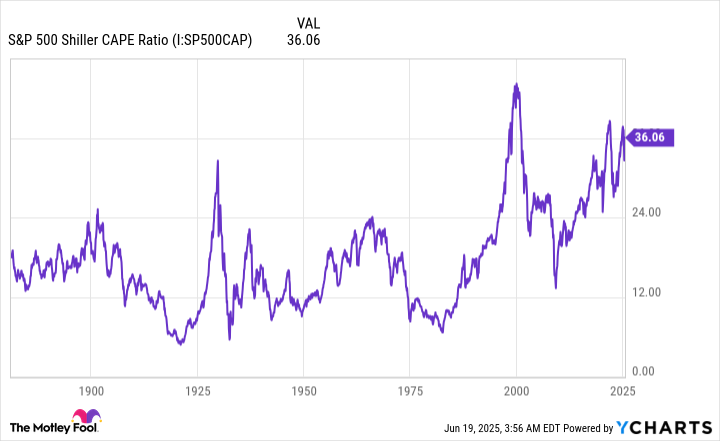
S&P 500 Shiller CAPE Ratio data by YCharts.
As of the closing bell on June 18, the S&P 500's Shiller P/E Ratio stood at a multiple of 36.55. To put this into perspective, it's 112% above the average multiple of 17.25, when back-tested to January 1871. However, this massive deviation from the historical mean isn't the telltale sign of trouble for Wall Street.
What's far more concerning is how stocks have behaved following the rare instances where the Shiller P/E surpassed and held a multiple of 30 for a period of at least two months. Surpassing and sustaining 30 has occurred only six times in 154 years:
- August to September 1929
- June 1997 to August 2001
- September 2017 to November 2018
- December 2019 to February 2020
- August 2020 to May 2022
- November 2023 to present
Excluding the present, all five prior instances were eventually followed by declines ranging from 20% to 89% in the Dow Jones Industrial Average, S&P 500, and/or Nasdaq Composite.
To be clear, the Shiller P/E isn't a timing tool and can't, in any way, pinpoint when stock market corrections, bear markets, or crashes will begin. But what it does have an exceptional track record of doing is foreshadowing an eventual plunge in Wall Street's three major stock indexes.
Based solely on what history tells us, stocks won't be able to hold onto their current valuation premium, and the Dow, S&P 500, and Nasdaq Composite will, at some point in the presumed not-too-distant future, plunge.

Image source: Getty Images.
History is a pendulum that swings (disproportionately) in both directions
Considering that the S&P 500 has enjoyed one of its strongest two-month performances in 75 years, the prospect of the index once again plunging probably doesn't sit well with investors. There's simply no getting around the data that lofty valuation premiums aren't well tolerated on Wall Street over long periods.
But there is a major silver lining to this forecast. Specifically, history is a pendulum that swings in both directions and has disproportionately favored investors who've taken a long-term, optimistic approach.
As noted, the Dow Jones, S&P 500, and Nasdaq Composite tend to climb over long periods, but their directional movements over shorter timelines are anything but predictable. Corrections, bear markets, and even crashes are normal, healthy, and inevitable aspects of the investing cycle. No amount of well-wishing or fiscal/monetary policy maneuvering can prevent Wall Street's major stock indexes from occasionally declining by double-digit percentages.
However, the one noteworthy characteristic about double-digit percentage declines on Wall Street is they tend to be short-lived.
Two years ago, shortly after the benchmark S&P 500 established that it was in a new bull market, the analysts at Bespoke Investment Group published a data set on X (formerly Twitter) that compared the calendar-day length of every bull and bear market for the S&P 500 dating back to the start of the Great Depression in September 1929.
It's official. A new bull market is confirmed.
-- Bespoke (@bespokeinvest) June 8, 2023
The S&P 500 is now up 20% from its 10/12/22 closing low. The prior bear market saw the index fall 25.4% over 282 days.
Read more at https://t.co/H4p1RcpfIn. pic.twitter.com/tnRz1wdonp
On one hand, the typical bear market swoon lasted just 286 calendar days, which isn't even an average of 10 months. Conversely, the average S&P 500 bull market endured for 1,011 calendar days, or approximately 3.5 times as long. Being patient and optimistic has allowed investors to take advantage of this simple numbers game.
A separate analysis from Crestmont Research widened the lens even further. Its analysts calculated the rolling 20-year total returns, including dividends paid, of the S&P 500 dating back to the start of the 20th century. For those of you rightly recognizing that the S&P didn't exist prior to 1923, Crestmont tracked the performance of its components in other major indexes from 1900 to 1923 in order to back-test its total return data more than a century.
What Crestmont Research discovered was that all 106 rolling 20-year periods it examined (1900-1919, 1901-1920, and so on, to 2005-2024) generated a positive annualized total return. Hypothetically, they would have all made investors money, as long as investors held their position for 20 years.
Regardless of what any forecasting tool suggests will happen in the coming weeks, months, or couple of years, more than a century of total return data demonstrates the power of buying stocks and holding them over long periods.