One stock that has consistently outperformed the S&P 500 and Nasdaq Composite throughout the artificial intelligence (AI) revolution is the foundry and fabrication specialist Taiwan Semiconductor Manufacturing (TSM 2.65%). While its share price has posted monster gains of 174% over the last three years, there's still a good argument to be made that TSMC (as it's known for short) remains attractively valued.
Let's dig into the catalysts fueling such epic growth at TSMC and then assess some lesser-understood valuation techniques that may help investors see why the stock still looks attractive at its current price point.
TSMC's growth is off the charts...
Before diving into TSMC's financial profile, it's worth reviewing how the company fits into the broader AI picture. Companies such as Nvidia, Advanced Micro Devices, and Broadcom have enjoyed record growth over the last few years thanks to booming demand for their GPU clusters and data center networking equipment.
At the same time, hyperscalers such as Microsoft, Amazon, and Alphabet have experienced surging growth across their integrated AI ecosystems -- including applications in cloud computing infrastructure, cybersecurity, workplace productivity software, and more.

NYSE: TSM
Key Data Points
While rising capital expenditures represent strong tailwinds for GPU and custom ASIC businesses, the trend is arguably even more favorable for foundry services such as TSMC. Why is that? Simply put, it actually manufactures many of the chipsets and systems equipment sold by the companies referenced above. Budget increases for chips and infrastructure represent a hidden -- and often overlooked -- tailwind for TSMC, regardless of whose chips are in demand.
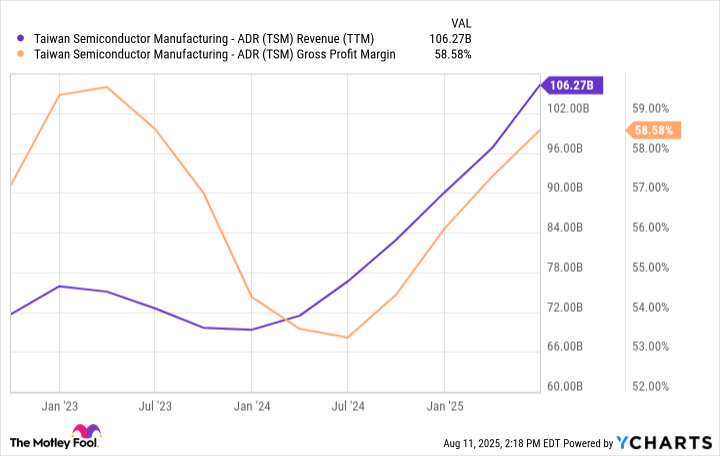
TSM Revenue (TTM) data by YCharts; TTM = trailing 12 months.
TSMC's mission-critical fabrication solutions provide the company with significant pricing power. These dynamics can be seen from the financial profile above, underscored by the company's steepening revenue growth trend in parallel with improving gross profit margins.

Image source: Getty Images.
... and it appears it can sustain this growth
One of the interesting aspects of TSMC's investor materials is that the company publishes revenue growth reports on a monthly basis rather than solely in a quarterly report. In the table below, I've summarized the company's monthly revenue growth throughout 2025:
| Category | January | February | March | April | May | June | July |
|---|---|---|---|---|---|---|---|
| Revenue growth YoY | 35.9% | 43.1% | 46.5% | 48.1% | 39.6% | 26.9% | 25.8% |
Data source: TSMC Investor Relations.
During the second quarter, TSMC generated $30 billion in sales thanks to continued demand for highly coveted 5nm and 3nm chip nodes. Revenue growth seems to have stalled a bit in June and July, but I do not see this as a long-term trend.
Keep in mind that new GPU architectures such as Nvidia's Blackwell and AMD's MI350 and MI400 series are still in early stages of rollout and development. As infrastructure spending continues to accelerate across the AI landscape, TSMC is in position to benefit from such robust secular themes.
Why I think TSMC stock is dirt cheap
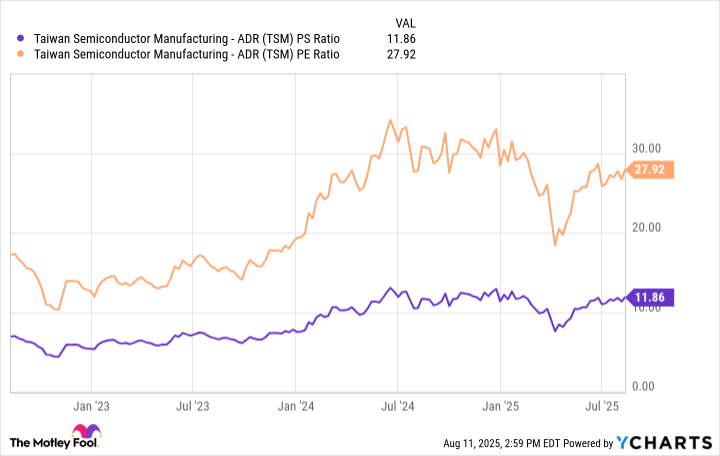
Common valuation methodologies often include ratios such as price-to-sales (P/S) or price-to-earnings (P/E). These metrics can be helpful when benchmarking a company against a set of peers, but they can be misleading when these ratios begin to expand meaningfully.
For example, if you take a look at the chart below, you'll notice that TSMC's P/S and P/E multiples have risen throughout the AI revolution. Such a degree of valuation expansion might lead investors to believe that the stock is overbought and has become pricey. While such logic has merit, it does not always apply.
TSM PS Ratio data by YCharts.
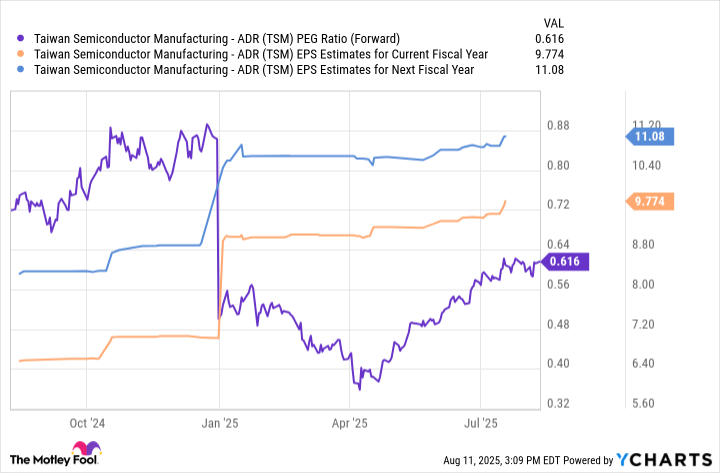
A more nuanced way to value the chipmaker is by using its price/earnings-to-growth ratio (PEG), a metric popularized by legendary fund manager Peter Lynch. Essentially, it accounts for the P/E ratio as well as the earnings growth over a period of time. A good rule of thumb is that a PEG ratio below 1.0 signals that the stock is undervalued.
TSM PEG Ratio (Forward) data by YCharts; EPS = earnings per share.
Per the chart above, the stock has a PEG ratio based on next year's earnings of 0.6. I think the PEG ratio compression illustrated above can be attributed to a few factors.
Wall Street's bullish view calls for the anticipation of accelerating earnings from TSMC supported by ongoing AI infrastructure spend. However, increased earnings revisions are likely outpacing appreciation in Taiwan Semi stock -- basically normalizing the company's PEG ratio without a sell-off as the primary driver.
In addition, I think the market might be underpricing TSMC due to broader macro uncertainty surrounding geopolitical tensions with China or general cyclicality of the chip market. The combination of PEG ratio compression and a robust financial outlook could make the stock a textbook candidate for investors seeking growth at a reasonable price.
To me, the stock is dirt cheap at its current price point relative to its growth. Investors with a long-term time horizon may want to take advantage of this rare opportunity to own a chip stock positioned to ride and dominate the AI infrastructure wave. While many semiconductor and AI stocks continue to trade at a premium, TSMC appears to be an undervalued opportunity anchored amid a sea of frothy valuations.


