For the better part of the last six decades, Berkshire Hathaway's (BRK.A +0.09%)(BRK.B +0.15%) billionaire CEO Warren Buffett has made a habit of outperforming the benchmark S&P 500 (^GSPC +0.32%) on a total return basis, including dividends. Whereas Wall Street's most-followed index has returned in the neighborhood of 45,500%, with dividends, over the last 60 years, the Oracle of Omaha has overseen a cumulative return in his company's Class A shares (BRK.A) of more than 5,780,000%, as of the closing bell on Oct. 31.
It can be argued that no money manager's trading activity is more closely tracked than that of Warren Buffett. After all, his acquisition and investment activity allowed Berkshire to join the trillion-dollar club.
But there's a grim reality Wall Street and investors have to come to terms with: Berkshire's billionaire boss hasn't been doing a lot of buying for three years, and counting.

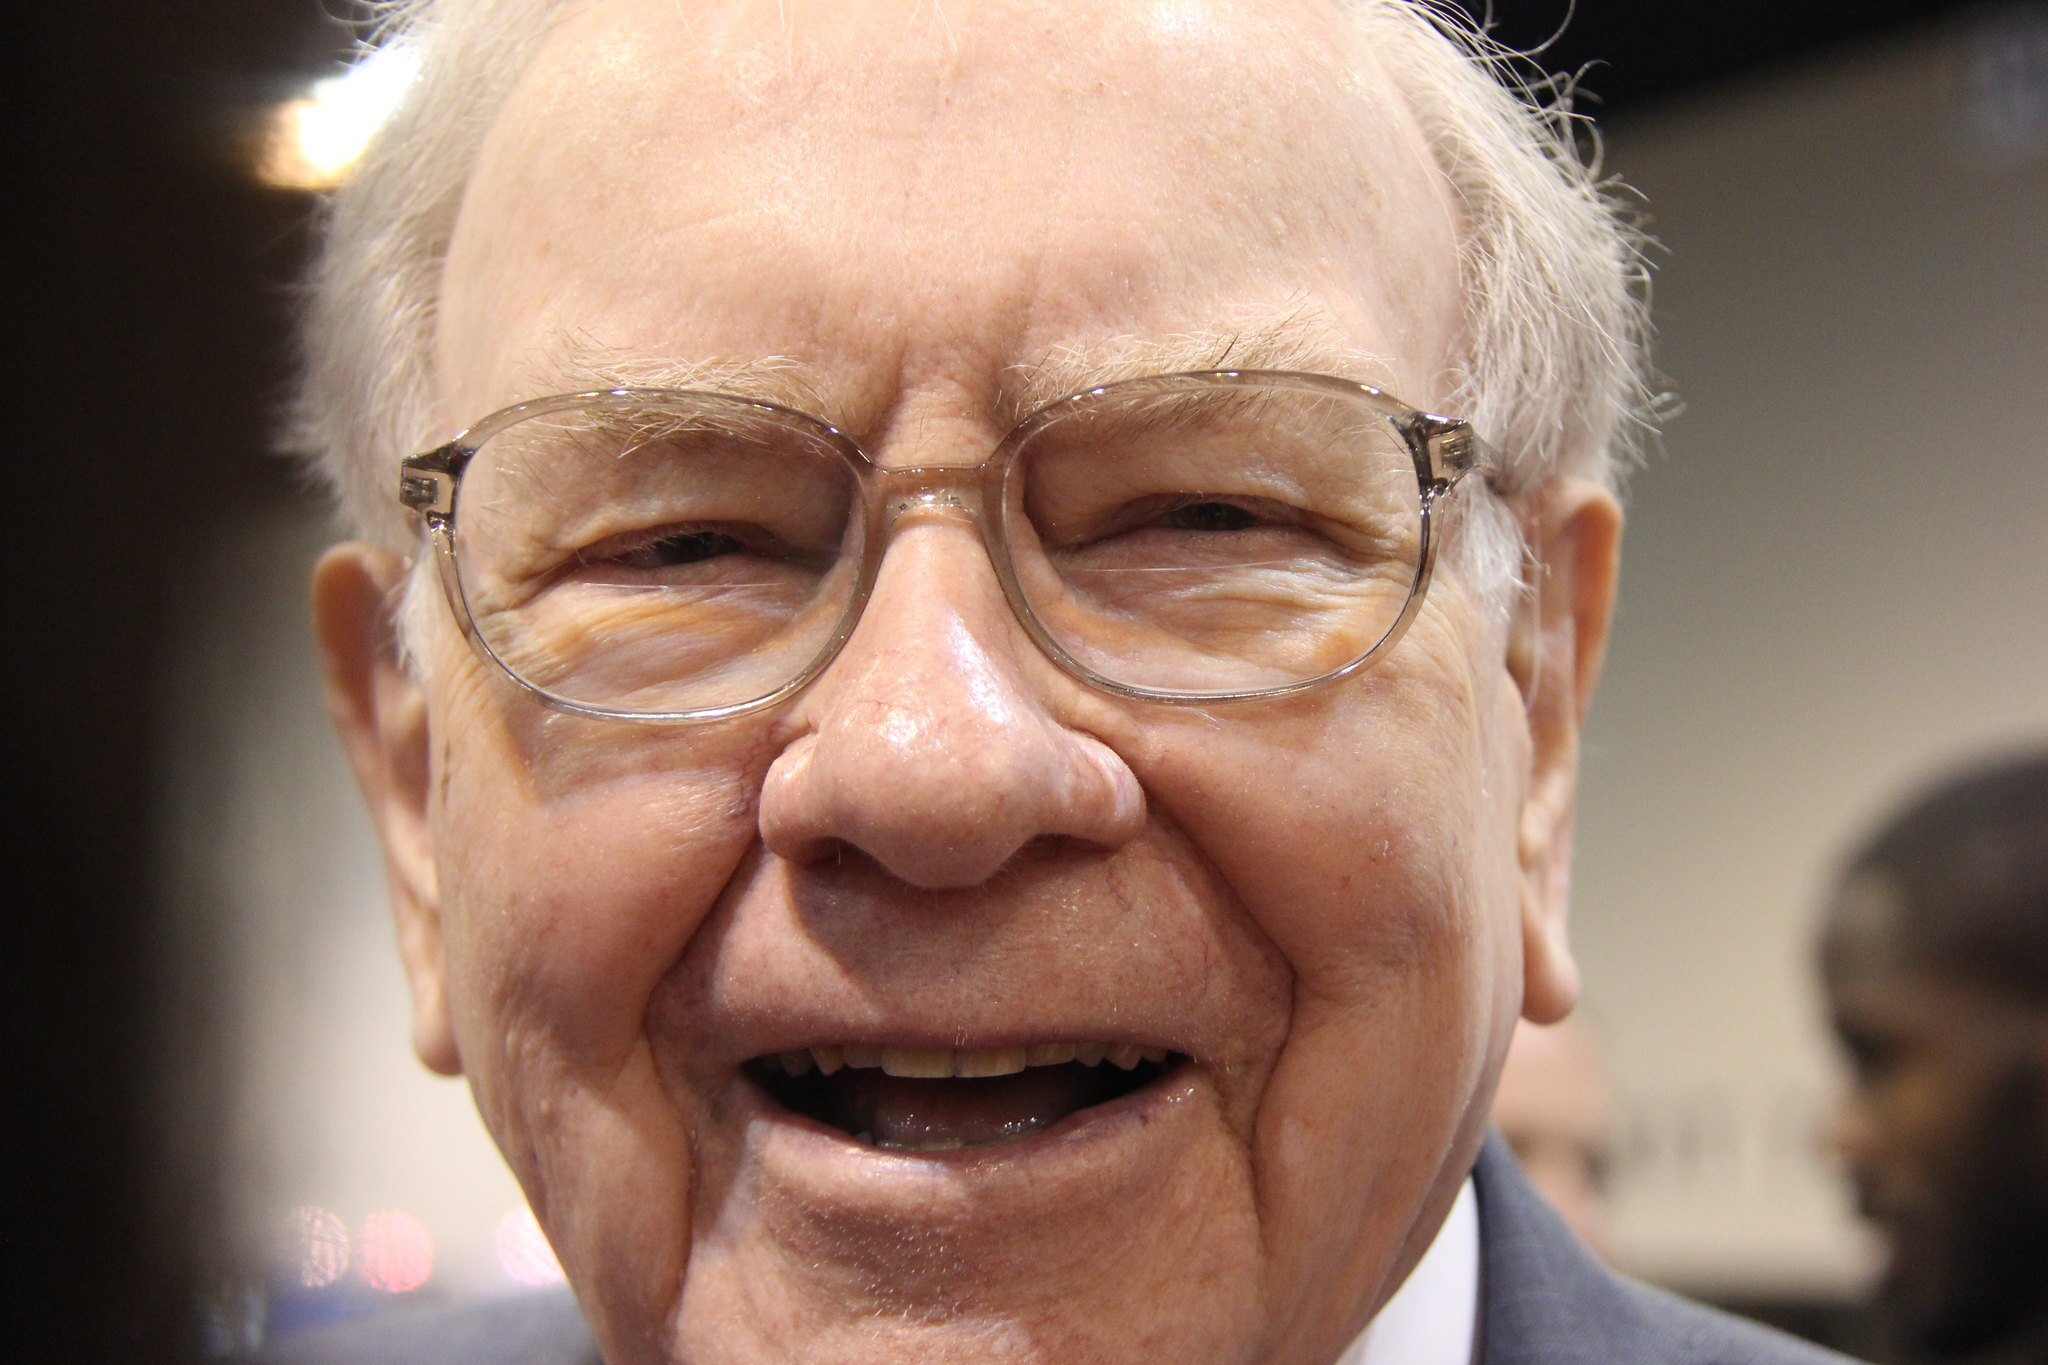
Berkshire Hathaway CEO Warren Buffett. Image source: The Motley Fool.
Warren Buffett's $184 billion warning to Wall Street has hit a crescendo
To track Buffett's trading activity, investors eagerly await the filing of Form 13Fs with the Securities and Exchange Commission. A 13F is required to be filed no later than 45 calendar days following the end to a quarter by institutional investors with at least $100 million in assets under management. It provides a snapshot of the specific stocks Buffett has been buying and selling.
However, investors don't have to wait till Nov. 14 (the filing deadline for 13Fs detailing third-quarter trading activity) to get a feel for what Berkshire's head honcho has been up to.
On Saturday, Nov. 1, Berkshire Hathaway released its third-quarter operating results, which paint a very clear picture of how Warren Buffett has approached his investing activity. On page 7 of this report, investors will find a consolidated cash flows statement. The two line items of interest can be found under cash flows from investing activities: "purchases of equity securities" and "sales of equity securities."
During the September-ended quarter, Buffett oversaw the purchase of $6.355 billion in equities, as well as the sale of $12.454 billion in securities. On a net basis, $6.099 billion more in stocks was sold in the third quarter than was purchased.

NYSE: BRK.B
Key Data Points
This has been a common theme for Buffett, with the third quarter representing the 12th straight quarter of net-selling activity:
- Q4 2022: $14.64 billion in net-equity sales
- Q1 2023: $10.41 billion
- Q2 2023: $7.981 billion
- Q3 2023: $5.253 billion
- Q4 2023: $0.525 billion
- Q1 2024: $17.281 billion
- Q2 2024: $75.536 billion
- Q3 2024: $34.592 billion
- Q4 2024: $6.713 billion
- Q1 2025: $1.494 billion
- Q2 2025: $3.006 billion
- Q3 2025: $6.099 billion
Collectively, $183.53 billion more in stocks have been sold than purchased since Oct. 1, 2022. This selling activity is a direct and deafening warning to Wall Street and everyday investors.
Value is almost impossible to find in today's stock market
To preface the following discussion, Warren Buffett has repeatedly stated that he wouldn't bet against America, which signals his understanding that the U.S. economy tends to grow over time, and major indexes like the S&P 500 rise over long periods.
Nevertheless, value is the most important of all variables for Berkshire's billionaire chief when it comes to investing. He's simply unwilling to buy shares of a public company if he doesn't feel as if he's getting a good deal. A quick look at stock market valuations reveals why he's been a net-seller of stocks for 12 consecutive quarters (and counting).
Warren Buffett Indicator hits a new all-time high of 223%, the most expensive stock market valuation in history 🚨🚨 pic.twitter.com/p14CI3VXGu
-- Barchart (@Barchart) October 26, 2025
For example, the market-cap-to-GDP ratio, which has come to be known as the "Buffett Indicator," hit an all-time high last week. This ratio is arrived at by dividing the aggregate value of all public companies by U.S. gross domestic product (GDP), and it was once touted as, "probably the best single measure of where valuations stand at any given moment" by Buffett in a 2001 interview with Fortune magazine.
When back-tested to 1970, the Buffett Indicator has averaged about 85%. In other words, the cumulative value of all public companies has equated to approximately 85% of U.S. GDP. On Monday, Oct. 27, the Buffett Indicator hit a never-before-seen high of 225.51%.
But this isn't the only valuation-based tool that points to big-time trouble for the stock market.
Last week, the S&P 500's Shiller Price-to-Earnings (P/E) Ratio, which is also known as the cyclically adjusted P/E Ratio (CAPE Ratio), reached a multiple of 41.20. This marked a new high for the current bull market and is the second-priciest Shiller P/E multiple during any continuous bull market dating back to January 1871.
Over the last 154 years, there have only six instances, including the present, where the S&P 500's Shiller P/E has surpassed and held 30 for at least a two-month period. Following the prior five occurrences, the S&P 500 eventually plunged by at least 20%, if not significantly more.
Buffett's net-selling activity couldn't be a clearer sign that he believes stocks are grossly expensive in the short run.

Image source: Getty Images.
The Oracle of Omaha won't bet against America
Despite having a record amount of cash -- consisting of cash, cash equivalents, and U.S. Treasuries -- on hand ($381.6 billion), Buffett's net-selling activity demonstrates his willingness not to chase stocks higher when the value proposition doesn't make sense.
On the other hand, we're also witnessing the long-term thinking that's made the Oracle of Omaha such a great investor come into play.
In Buffett's 2023 letter to shareholders, he outlined eight stocks that were deemed "indefinite" holdings. This included Berkshire's longest-tenured stocks, Coca-Cola and American Express, integrated oil and gas giant Occidental Petroleum, and the five Japanese trading houses that he and incoming Berkshire CEO (as of January 2026) Greg Abel have been building positions in. Seemingly under no circumstances are these stocks to be pared down or removed from Berkshire Hathaway's portfolio.
But when stepping back and looking at the bigger picture, Berkshire's investment portfolio still clocks in at $313.6 billion, as of the closing bell on Oct. 31. Even with $184 billion in net selling activity spanning three years, Berkshire's boss is looking to the horizon and holding firm on many of his company's core positions.
As noted earlier, Buffett is aware of the disproportionate nature of economic cycles, and uses this nonlinearity to his advantage. Whereas the average U.S. recession since the end of World War II has resolved in 10 months, the typical economic expansion has stuck around for approximately five years. This provides plenty of opportunity for the U.S. economy to grow over long periods.
It's official. A new bull market is confirmed.
-- Bespoke (@bespokeinvest) June 8, 2023
The S&P 500 is now up 20% from its 10/12/22 closing low. The prior bear market saw the index fall 25.4% over 282 days.
Read more at https://t.co/H4p1RcpfIn. pic.twitter.com/tnRz1wdonp
Likewise, bull and bear markets on Wall Street aren't proportional. Based on data from the analysts at Bespoke Investment Group, the average S&P 500 bear market, dating back to the start of the Great Depression in September 1929, has lasted just 286 calendar days, or about 9.5 months.
When the pendulum swings in the other direction, S&P 500 bull markets were shown to last an average of 1,011 calendar days since September 1929. That's roughly 3.5 times longer than the typical bear market.
Even though Warren Buffett is a decisive net-seller of stocks right now, and his actions make clear that equities are incredibly pricey, he's still positioned Berkshire Hathaway to benefit from long-term economic expansion.