In a little over five weeks, the curtain will close on 2025, and investors will likely be looking back on another banner year for Wall Street. Recently, the benchmark S&P 500 (^GSPC +0.03%), widely followed Dow Jones Industrial Average (^DJI 0.58%), and growth-focused Nasdaq Composite (^IXIC +0.28%) all reached fresh record-closing highs.
While history tells us that Wall Street's major stock indexes climbing over long periods is to be expected, it also shows that volatility is normal, inevitable, and the price paid by investors for access to the world's greatest wealth-creating machine.
As the S&P 500, Dow Jones, and Nasdaq Composite have pushed higher, stock valuations have followed suit. Wall Street and investors have been largely content to turn a blind eye as the prospect of lower interest rates and the hype surrounding the evolution of artificial intelligence lift the stock market to new heights.
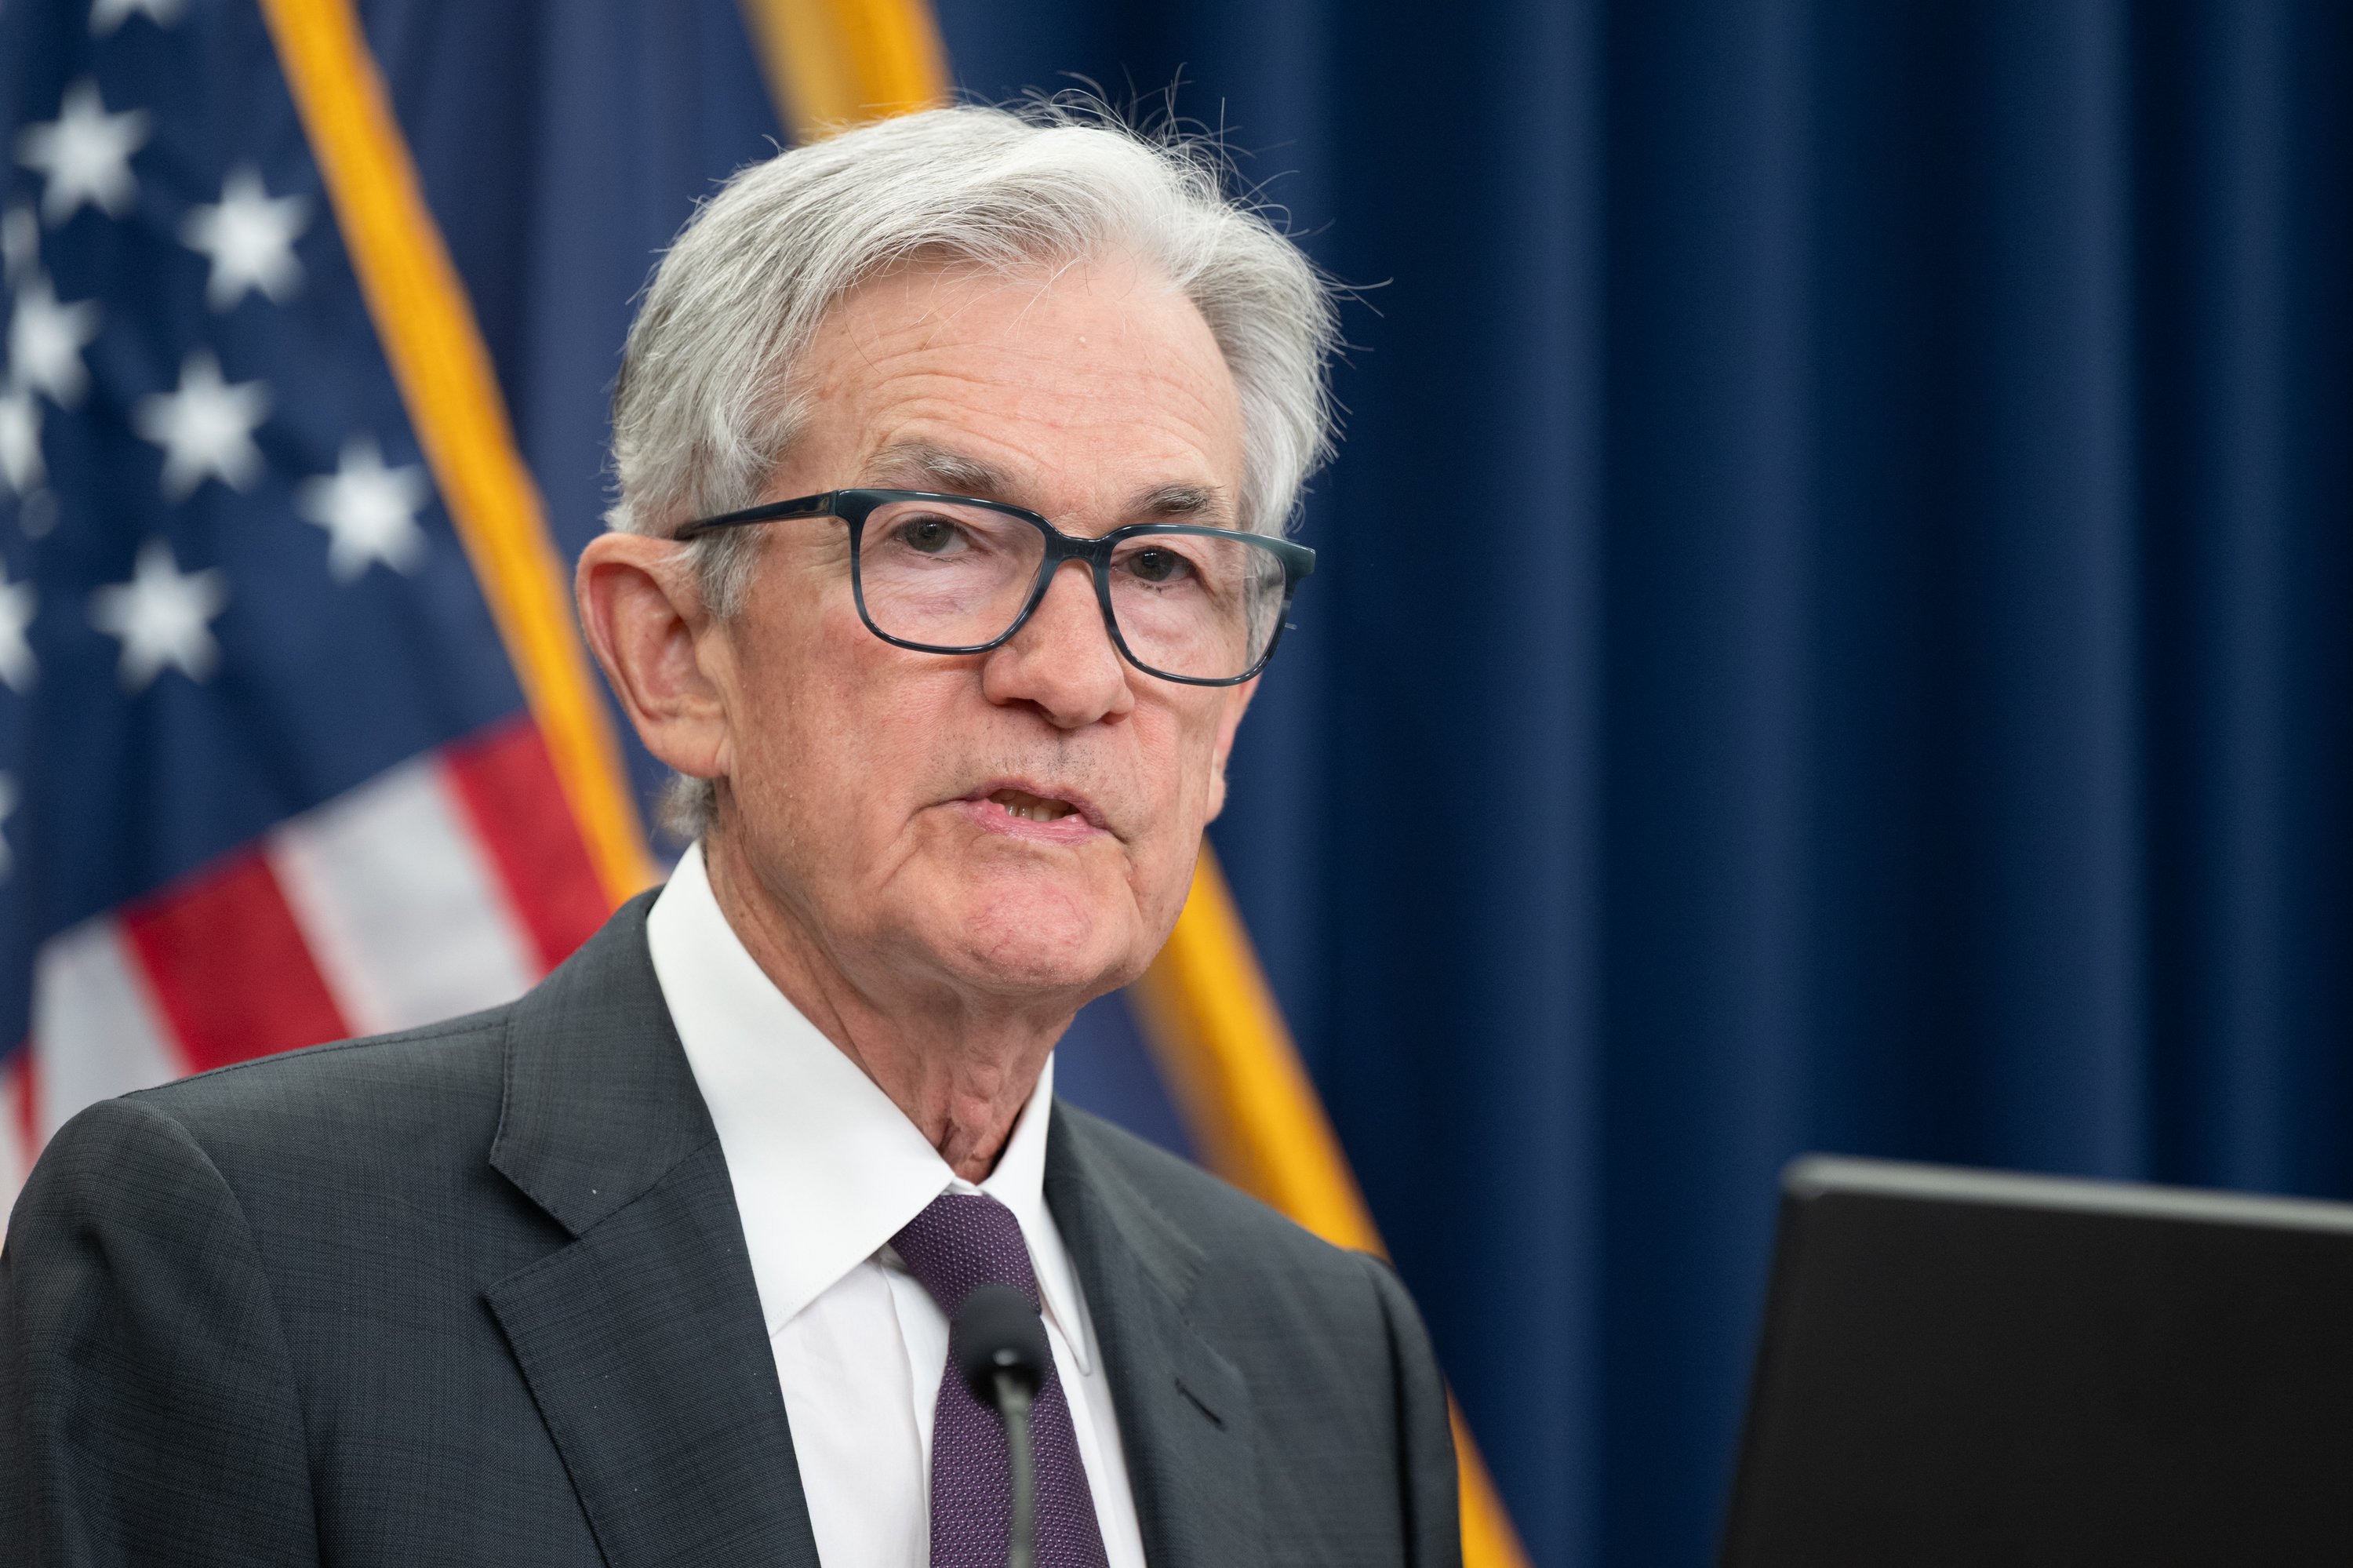
However, Federal Reserve Chair Jerome Powell may have burst Wall Street's bubble by uttering the six words investors are all thinking but are too terrified to accept.

Federal Reserve Chair Jerome Powell delivering remarks. Image source: Official Federal Reserve Photo.
Jerome Powell forces Wall Street and investors to confront reality
The Federal Reserve's job is to guide our nation's monetary policy to promote a healthy job market and maintain stable prices. While this is a sticks-and-stones definition of what the central bank aims to do, its members consider a wide range of data points when deciding on the actions that will help meet those goals.
In late September, Fed Chair Powell delivered a speech in Rhode Island, where he was questioned about the variables the Fed's Board of Governors considers when making monetary policy decisions. In particular, he was asked if movements in the stock market factor into the central bank's decision-making process.
While Powell typically avoids making direct remarks on equities, he was rather candid in his response. The six words of note that resounded in a deafening roar on Wall Street were, "equity prices are fairly highly valued."
To be fair, Powell isn't the first Fed chair to bring to light the priciness of the stock market at specific moments in time. In December 1996, former Fed Chair Alan Greenspan delivered what became known as his "irrational exuberance" speech, highlighting the rapidly rising prices of equities on the heels of the internet revolution. Nevertheless, it took more than three years after Greenspan's speech before the S&P 500, Dow Jones Industrial Average, and Nasdaq Composite, respectively, reached their peaks.
But Powell's speech does shed light on the historical precedent of a pricey stock market -- and that's something Wall Street and investors may be too scared to accept.
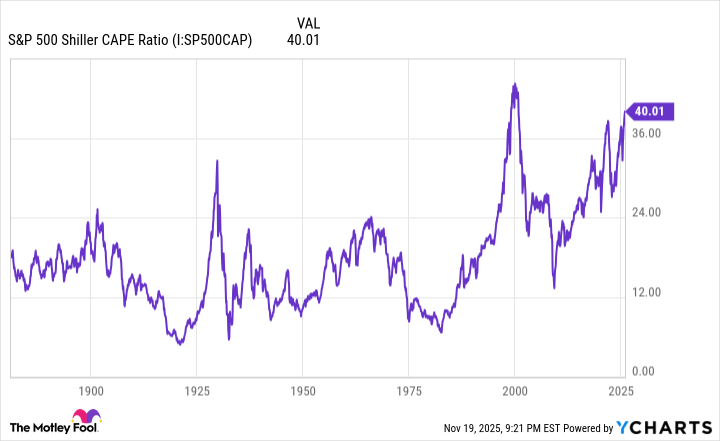
S&P 500 Shiller CAPE Ratio data by YCharts.
One of the best apples-to-apples valuation measures on Wall Street is the S&P 500's Shiller Price-to-Earnings (P/E) Ratio, which is also known as the cyclically adjusted P/E Ratio, or CAPE Ratio.
Unlike the traditional P/E ratio, which is based on trailing-12-month earnings per share (EPS), the Shiller P/E is based on average inflation-adjusted EPS over the previous 10-year period. Expanding the scope of what's being accounted for ensures that shock events can't skew the readings.
When back-tested to January 1871, the S&P 500's Shiller P/E has averaged a multiple of 17.31. However, it's spent much of the last 30 years above this 154-year average, mainly due to the internet breaking down information barriers between Wall Street and Main Street, and lower interest rates encouraging more risk-taking by investors.
In late October, the Shiller P/E Ratio peaked at a multiple of 41.20, marking the highest reading during the current bull market and the second-highest multiple during any continuous bull market since 1871. The only pricier stock market in history achieved a Shiller P/E multiple of 44.19 in the months leading up to the bursting of the dot-com bubble.
Over the past 154 years, the CAPE Ratio has crested 30 during a continuous bull market on six separate occasions, including the present. Following the five previous occurrences, the S&P 500, Dow Jones Industrial Average, and Nasdaq Composite have plunged between 20% and 89%. While the 89% figure refers to the Dow's peak-to-trough decline during the Great Depression, and a depression is highly unlikely in today's economy, historical precedent suggests that, eventually (keyword!), Wall Street's major stock indexes are going to endure a steep move lower.
Wall Street and investors may not appreciate Jerome Powell's candor when it comes to stock valuations, but history suggests that the Fed Chair is correct in his assessment.

Image source: Getty Images.
Moments of peril provide opportunities for long-term investors to pounce
If history were to repeat itself, investors can once again expect the benchmark index to decline by at least 20% from its high at some point in the not-too-distant future, with the technology-heavy Nasdaq Composite likely falling by even more.
Although this isn't the rosiest of outlooks, investor perspective changes everything.
Stock market corrections, bear markets, and those pesky elevator-down moves that can cause panic on Wall Street share one thing in common: they're historically short-lived. While downturns in the S&P 500, Dow Jones, and Nasdaq Composite are known for tugging on investors' heartstrings, their common denominator is being over in the relative blink of an eye.
In June 2023, shortly after the S&P 500 officially entered a new bull market by climbing 20% from its October 2022 bear market low, the analysts at Bespoke Investment Group published the data set below on X (formerly Twitter). It compared the calendar-day length of every S&P 500 bull and bear market dating back to the start of the Great Depression (September 1929).
It's official. A new bull market is confirmed.
-- Bespoke (@bespokeinvest) June 8, 2023
The S&P 500 is now up 20% from its 10/12/22 closing low. The prior bear market saw the index fall 25.4% over 282 days.
Read more at https://t.co/H4p1RcpfIn. pic.twitter.com/tnRz1wdonp
What you'll note is a marked difference in length between optimism and pessimism on Wall Street. The average bear market endured for just 286 calendar days, or roughly 9.5 months, between September 1929 and June 2023. In comparison, the typical S&P 500 bull market has lasted for 1,011 calendar days, or approximately 3.5 times longer than the average bear market.
Digging deeper, no S&P 500 bear market persisted for more than 630 calendar days. If the current bull market were extrapolated to the present day, it would mark the 14th bull market out of 27 since September 1929 that has lasted longer than 630 calendar days.
What Bespoke Investment Group's data set conclusively shows is that instances of peril and pessimism on Wall Street pave the way for opportunistic, long-term-minded investors to pounce. If your investing horizon is five or more years, stock market corrections, bear markets, and elevator-down moves are sights to be welcomed and not feared.