Dividend investors know that it pays to follow how much of a company's money goes toward funding its payouts. A nice yield now won't matter much if the company can't keep making those payments going forward.
Here, we'll highlight a given company and its closest competitors to see just how safe their dividends are, with a little help from three crucial tools:
- The interest coverage ratio, or earnings before interest and taxes, divided by interest expense. The interest coverage ratio measures a company's ability to pay the interest on its debt. An interest coverage ratio less than 1.5 is questionable; a number less than 1 means that the company is not bringing in enough money to cover its interest expenses.
- The EPS payout ratio, or dividends per share divided by earnings per share. The EPS payout ratio measures the percentage of earnings that go toward paying the dividend. A ratio greater than 80% is worrisome.
- The FCF payout ratio, or dividends per share divided by free cash flow per share. Earnings alone don't always paint a complete picture of a business' health. The FCF payout ratio measures the percentage of free cash flow devoted toward paying the dividend. Again, a ratio greater 80% could be a red flag.
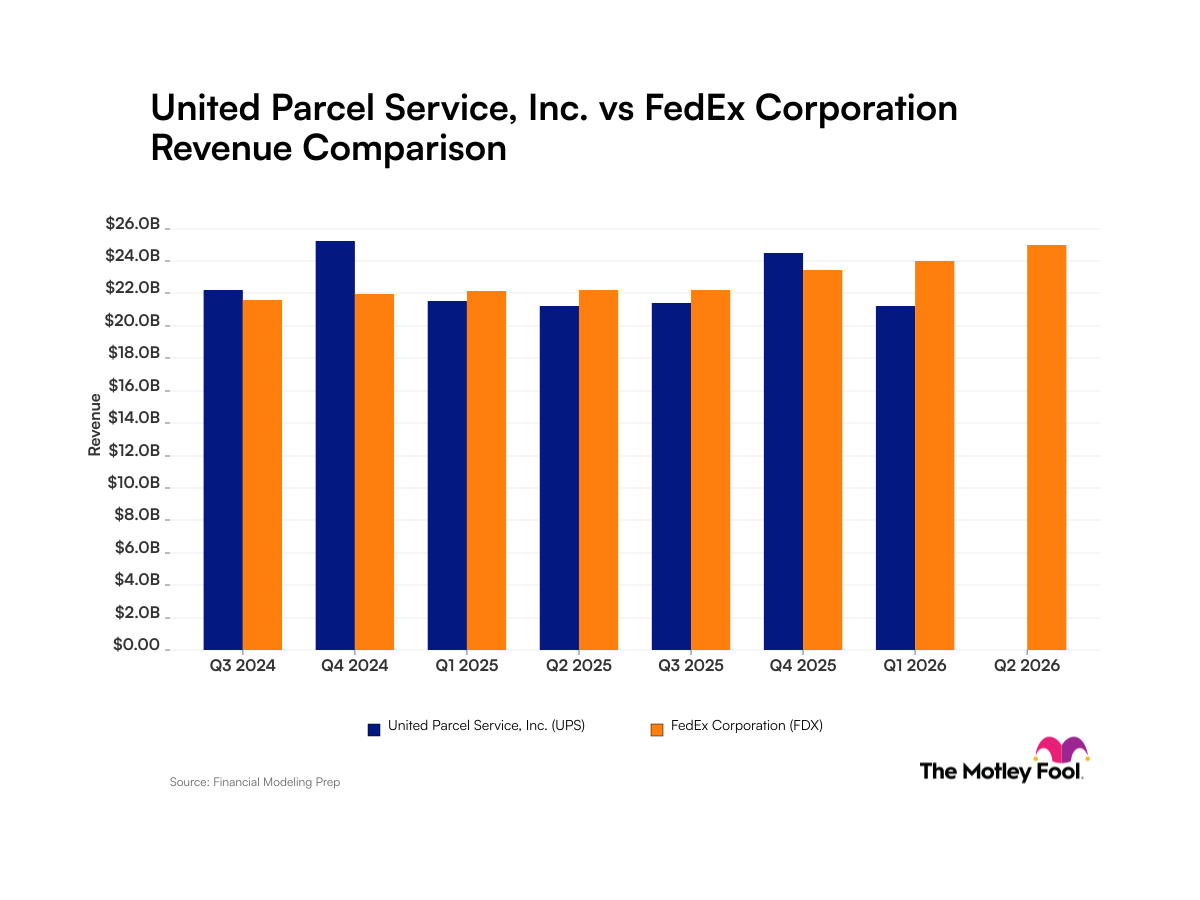
Each of these ratios reflect dividends paid in the trailing 12 months; yields are the expected forward yield. Let's examine UPS(NYSE: UPS) and three of its peers.
|
Company |
Yield |
Interest Coverage |
EPS Payout Ratio |
FCF Payout Ratio |
|---|---|---|---|---|
| UPS |
2.8% |
17.2 |
50.4% |
50.0% |
| FedEx (NYSE: FDX) |
0.6% |
32.9 |
10.7% |
-199.7% |
| Norfolk Southern (NYSE: NSC) |
2.1% |
6.0 |
34.5% |
109.6% |
| Union Pacific (NYSE: UNP) |
1.9% |
8.6 |
24.4% |
38.6% |
Source: Capital IQ, a division of Standard & Poor's.
With an interest coverage of 17.2, UPS covers every $1 in interest expenses with just over $17 in operating earnings. Given that its EPS payout ratio and FCF payout ratio are below 50%, you shouldn't have to worry that UPS will need to cut its dividend anytime soon. The company has been doing well, and analysts like UPS's valuation more than that of close rival FedEx.
Another tool for better investing
Most investors don't keep tabs on their companies. That's a mistake. If you take the time to read past the headlines and crack a filing now and then, you're in a much better position to spot potential trouble early. We can help you keep tabs on your companies with My Watchlist, our free, personalized stock-tracking service.
- Add UPS to My Watchlist.
- Add FedEx to My Watchlist.
- Add Norfolk Southern to My Watchlist.
- Add Union Pacific to My Watchlist.