Not all dividends are created equal. Here, we'll do a top-to-bottom analysis of a given company to understand the quality of its dividend and how that's changed over the past five years.
The company we're looking at today is Caterpillar (NYSE: CAT), which yields 2.1%.
Industry
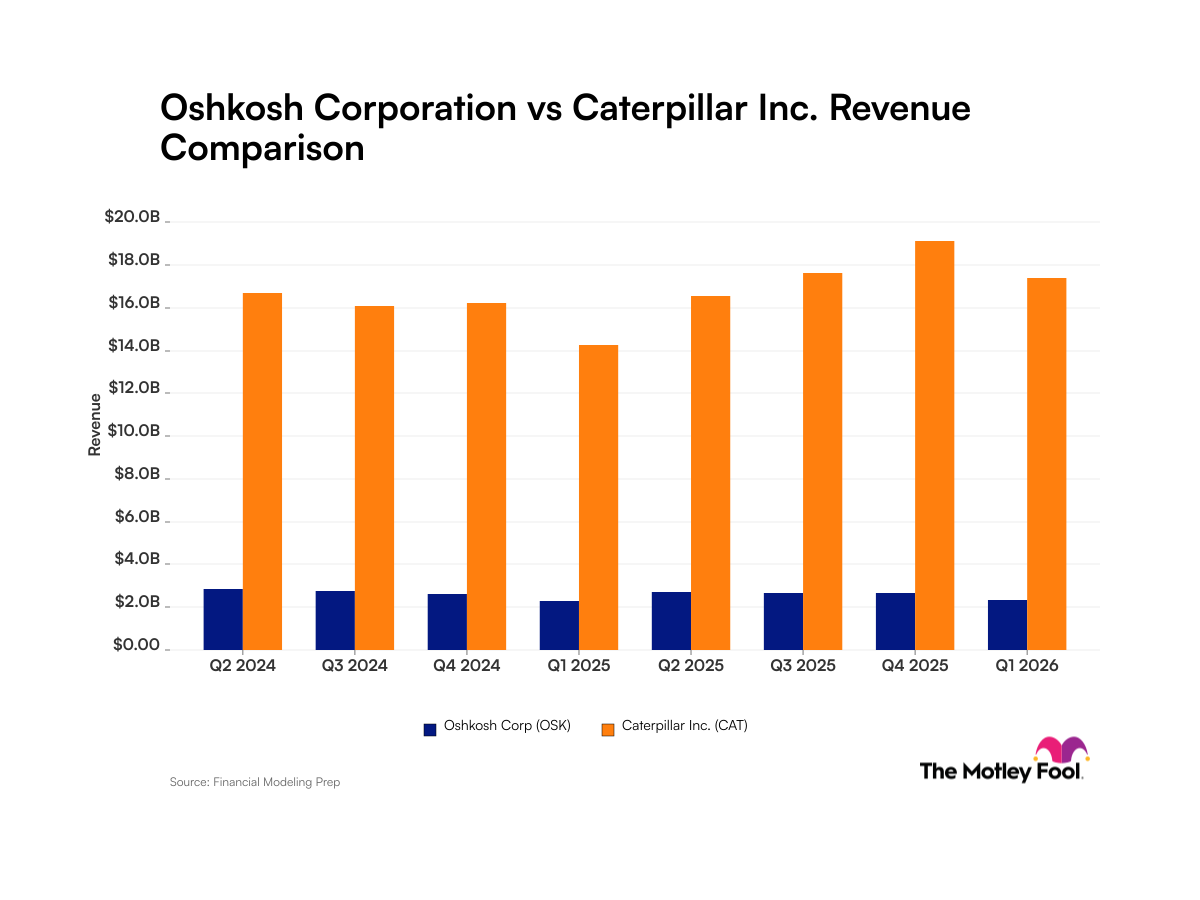
Caterpillar makes large construction equipment. The company reported stellar operating results in the third quarter, with a 58% increase in earnings over the previous year and 55% increase in Asia-Pacific revenue growth. Competitors PACCAR (NYSE: PCAR) and Deere (NYSE: DE) also posted strong quarters while Cummins (NYSE: CMI) was the one of the few competitors that did not meet expectations. The construction-equipment industry is very cyclical, and Caterpillar's stock tends to move with the economy.

Caterpillar Total Return Price Chart by YCharts
Dividend
To evaluate the quality of a dividend, the first thing to consider is whether the company has paid a dividend consistently over the past five years, and, if so, how much has it grown.

Caterpillar Dividend Chart by YCharts
Caterpillar's dividend has been steadily rising since 2007.
Immediate safety
To understand how safe a dividend is, we use three crucial tools, the first of which is:
- The interest coverage ratio, or the number of times interest is earned, which is calculated by earnings before interest and taxes, divided by interest expense. The interest coverage ratio measures a company's ability to pay the interest on its debt. A ratio less than 1.5 is questionable; a number less than 1 means the company is not bringing in enough money to cover its interest expenses.

Caterpillar Times Interest Earned (TTM) Chart by YCharts
Caterpillar covers every $1 in interest expense with $6 in operating earnings.
Sustainability
The other tools we use to evaluate the safety of a dividend are:
- The EPS payout ratio, or dividends per share divided by earnings per share. The EPS payout ratio measures the percentage of earnings that go toward paying the dividend. A ratio greater than 80% is worrisome.
- The FCF payout ratio, or dividends per share divided by free cash flow per share. Earnings alone don't always paint a complete picture of a business's health. The FCF payout ratio measures the percent of free cash flow devoted toward paying the dividend. Again, a ratio greater than 80% could be a red flag.

Source: S&P Capital IQ.
Caterpillar's payout ratios have been more volatilve than I would expect; however, its free cash flow payout ratio has been relatively stable at under 50% since 2009.
Another tool for better investing
Most investors don't keep tabs on their companies. That's a mistake. If you take the time to read past the headlines and crack a filing now and then, you're in a much better position to spot potential trouble early. We can help you keep tabs on your companies with My Watchlist, our free, personalized stock-tracking service.
- Add Caterpillar to My Watchlist.