It's been just over four and a half years since the Dow Jones Industrial Average (^DJI 0.77%) bottomed out in the spring of 2009. Since the index's lowest ebb, its overseers have replaced six components, and the Dow has surged from below 7,000 points to more than 16,000 points for the first time in its history. Because of the index's price-weighting structure, some stocks have had a far greater impact on that rise than others -- and perhaps none has had a greater impact than American Express (AXP 1.72%), which has been the Dow's single best-performing component from the day the market's rebound began, by a rather wide margin:

AXP Total Return Price data by YCharts
It's been a great four and a half years for AmEx shareholders as market participants have swarmed into financial stocks, including the four major credit card issuers. However, AmEx has not only trounced its fellow Dow components, but it's also far outpaced the market-beating gains of the two larger credit card issuers, Visa (V 1.82%) and MasterCard (MA 1.45%), the former of which became a Dow component this year in recognition of its importance to the American economy:
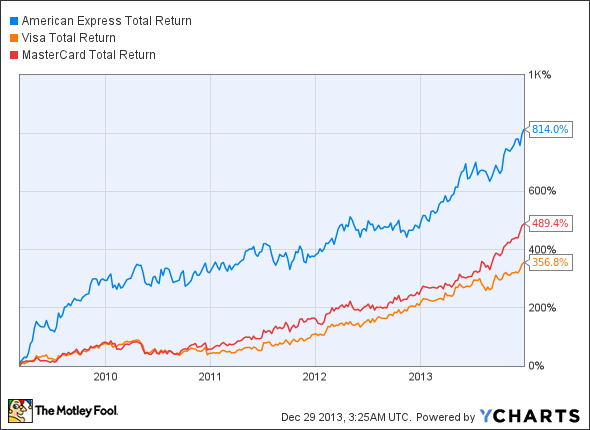
AXP Total Return Price data by YCharts
But can investors expect the same results next year? Not only was AmEx the Dow's best post-crash component, but it was also the Dow's best financial stock in 2013, and much of that growth was the result of valuation growth rather than an improvement in fundamentals. Let's dig into some of AmEx's past numbers and compare them with what the company (and analysts) now expects for the coming year.
The year ahead: by the numbers
|
Fiscal Year |
Earnings Per Share |
Year-Over-Year Growth Rate |
|---|---|---|
|
2009 |
$1.54 |
(33.9%) |
|
2010 |
$3.35 |
117.5% |
|
2011 |
$4.12 |
23% |
|
2012 |
$3.89 |
(5.6%) |
|
2013* |
$4.92 |
26.5% |
Sources: Morningstar and company press releases.
* 2013 EPS and growth rate are based on analyst estimates for the full year.
The many analysts who cover AmEx expect the company to post EPS results of $5.42 for 2014, which would be another 10.2% improvement over 2013's estimated finish. AmEx's analysts have been, on the whole, remarkably accurate recently -- none of the past four quarterly results have been more than 4% higher than the consensus estimate, and none was below consensus -- so it's probably reasonable to expect the company to finish in the projected range, give or take a few cents.
The question is: With its growth expected to slow, can AmEx continue to put on a supersized growth performance next year? Of the three largest card issuers, AmEx has produced the best gains, but it's also experienced by far the most growth in its valuation. Over the past year, Visa and MasterCard have both experienced a modest rise in P/E (Visa's valuation was affected midyear by the fact that an old write-off came off the books, but the trend is nonetheless clear), but AmEx's growth has been fueled almost entirely by P/E expansion:

AXP P/E Ratio (TTM) data by YCharts
That doesn't necessarily mean that AmEx is overvalued -- its 21 P/E sits well below MasterCard's 33 P/E and Visa's 29. AmEx's price-to-free cash flow level is also cheaper than either Visa's or MasterCard's, though it's not much cheaper than MasterCard's any more after its third-quarter report. The same is true of price-to-book values -- AmEx's price-to-book is around 5 at the moment, below Visa's 6 and less than half MasterCard's price-to-book value of 13. AmEx's valuation might be on the rise these days, but it certainly appears to have more room to run than those of its peers.
However, investors still need to watch trends in consumer spending, which appear to be moderating, as AmEx's third-quarter earnings showed slower growth in this metric than the company has been used to coming out of the recession. Since AmEx's target market is at the upper end of the income scale, it could be a dangerous sign for the rest of the economy if these consumers begin tightening their belts.