The minimum wage has been one of the hottest topics in politics this year, thanks to a concerted publicity effort from President Obama and other liberal leaders. The new minimum many of these leaders target is $10.10 an hour, which would push the real value of minimum-wage work close to all-time highs set almost half a century ago:
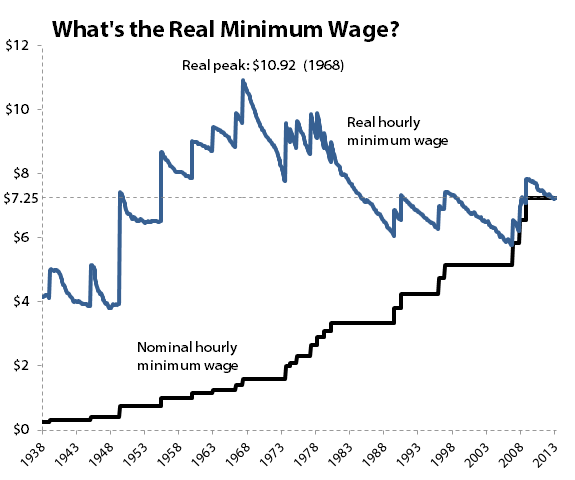
Source: U.S. Department of Labor. Adjusted with Consumer Price Index for Purchasing Power.
Many writers (myself included) have shown that the value of the minimum wage, beyond falling in real terms for decades, has also lost purchasing power against a broad basket of important expenses, and is weaker in relation to most other American workers than it has been for many years.
Raising the minimum wage to $10.10 by 2016 would do much to fix that weakness, but there are also widespread fears -- including some voiced by the Congressional Budget Office -- that raising the minimum wage would actually cost more American jobs than it benefits. The CBO's recent report projects a loss of 500,000 jobs should the minimum wage be raised to $10.10, even though the same report indicates that another 900,000 people would be lifted out of poverty. The benefit of higher wages for some might not outweigh the cost of so many additions to the safety-net rolls.
But is $10.10 really enough? Might it even be too much? That depends on a number of factors. For example, you'll occasionally hear that the minimum wage should simply be pegged to inflation. This is trickier than it sounds on the surface, because the starting point for our inflationary peg matters a great deal, especially if we want to start with the nominal minimum wage in effect at that point. This chart illustrates the problem with that argument:

Sources: U.S. Department of Labor and St. Louis Fed.
The starting rate of the minimum wage matters a great deal. If the minimum wage had simply been pegged to inflation (by tracking the Consumer Price Index) from its inception, it would be more than 40% lower today than it actually is because the very first minimum wage was so small. However, if the minimum wage began to track inflation after its postwar boost to $0.75 an hour -- the largest percentage increase in its history -- it would end up paying out about $7.44 an hour today. As you can see, that particular peg would have kept the minimum wage growing at very much the same pace as it actually has through legislation.
Things get interesting when we start pegging the minimum wage to inflation during its glory days. By starting our final inflationary peg in 1968, when the minimum wage was raised to $1.60 an hour (when adjusted for inflation, this is still the highest real minimum wage), we wind up pushing it well above its historical norms. And at a current rate of $10.90 an hour, that minimum wage tracks rather closely with what many Democrats are working for today, and makes an argument that $10.10 is too low, as inflation will almost certainly push the rate higher by 2016.
But if we force the minimum wage to track only certain components of the CPI, the picture again changes in important ways. We all know that health care costs have soared in our lifetimes, but what about rent? These are two of the most important components of any family's budget, and they present dramatically different pictures of inflation:
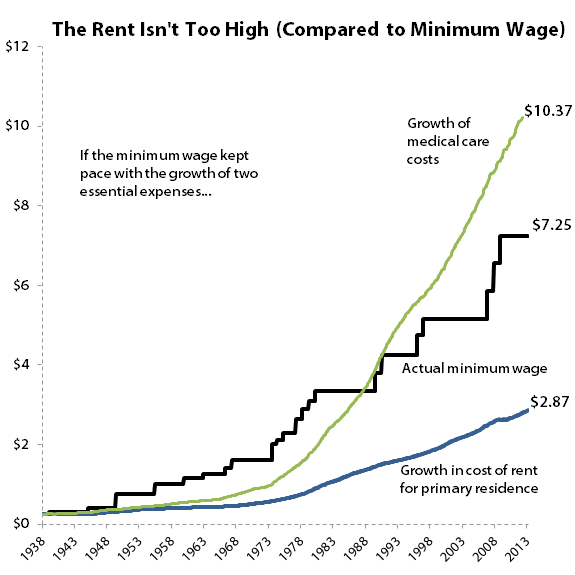
Sources: U.S. Department of Labor and St. Louis Fed.
Pegging the growth of the minimum wage to the rise in medical care spending -- which is calculated as the average urban American's out-of-pocket expense for doctor visits, hospital stays, prescription drugs, and so on -- again brings us to a level close to the $10.10 an hour now being pushed by many Democrats. But tracking rent costs gives us our lowest rate yet. However, the starting point again matters a great deal. If we begin our medical and rent pegs in 1968, today's minimum wage really starts to look inadequate:

Sources: U.S. Department of Labor and St. Louis Fed.
It's probably not realistic to peg the minimum wage to the growth of medical costs, but when we start tracking the rise of rents in 1968, we again find that the new $10.10 target is very close to what the minimum wage would be today if it simply followed the course of an essential expense.
Other economic measures continue to support the argument for a $10.10 minimum wage. The average monthly household income has actually surpassed the growth of inflation over time from all three starting points:
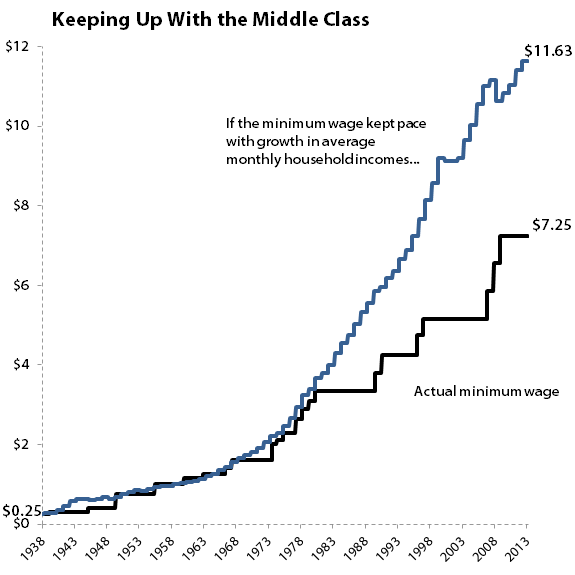
Sources: U.S. Department of Labor and St. Louis Fed.
There's not a great deal of difference between starting in 1938, 1950, or 1968. The highest adjusted minimum wage under this calculation is $12.93 an hour, which is reached from the 1950 starting point. A 1968 starting point produces an adjusted minimum wage of $12.02 an hour, so it does appear that there are some measures where even $10.10 an hour falls short.
It's important to distinguish between the average household income, which can be skewed by high earners, and the more popular median household income, which simply looks for the midpoint of American earning power, and which wasn't tabulated until years after the minimum wage became law. But since the average household income was roughly 10% higher than the median household income in 2012, this only serves to drop our new middle-class-adjusted minimum wage to about $10.50 an hour -- again, roughly in line with the higher rate liberal politicians are trying to implement.
Every now and again you'll hear someone argue that the minimum wage should be raised to reduce inequality between the richest and poorest Americans. However, if we treated America's poorest like America's richest, then the minimum wage might be a bit unsustainable:
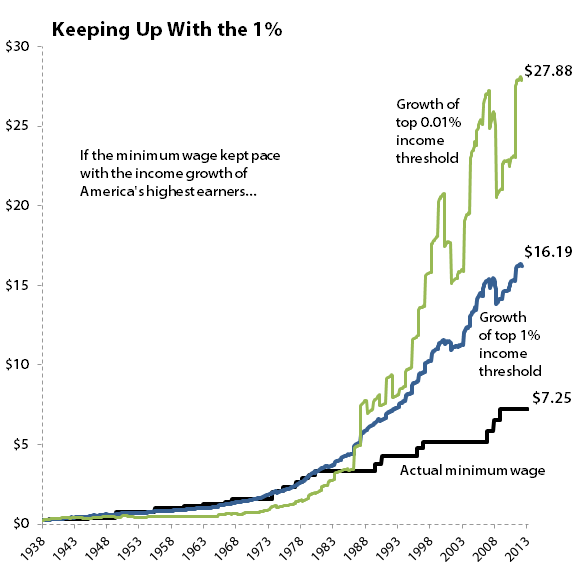
Sources: World Top Incomes Database and U.S. Department of Labor.
In the typical 40-hour, 50-week working year, these "minimum wage" earners would be taking home $32,380 (for the top 1%) and $55,760 (for the top 0.01%) a year! It's difficult to argue for this level of minimum wage when almost 40% of the American workforce made less than $20,000 a year in 2012, a year in which the median individual annual wage was just $27,519.
That's not to say that there's no argument for a minimum wage over twice as high as what we have today. In fact, when you look at growth of the American economy, and the growth of Americans' disposable income, you'll see that a $20 minimum wage might not be so crazy after all:
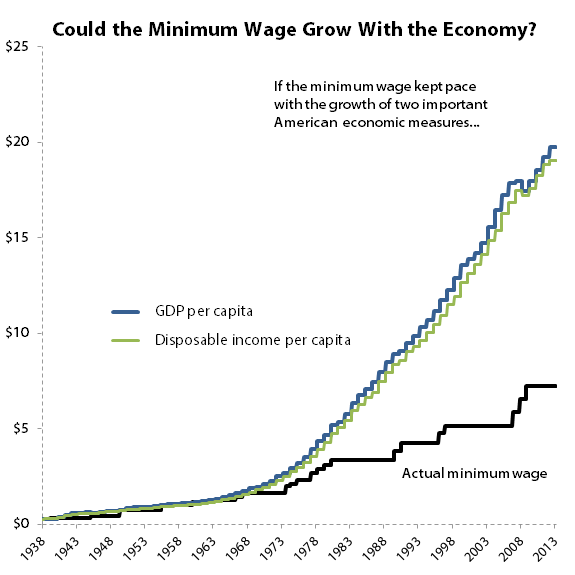
Sources: U.S. Department of Labor and St. Louis Fed.
Both adjustments, on a per-capita basis, push our new minimum wage over $19 an hour, and the results are similar when we adjust from 1950 and 1968 as well. If the American economy is really producing almost 8,000% more per person in nominal terms today than it was when the minimum wage was enacted, shouldn't every American have some claim to 8,000% more in nominal wages than their grandparents did in 1938?
There are a number of ways to frame the minimum wage debate, and these charts are only a starting point at best. When you look over the changes here, keep in mind that the American economy is incredibly complex and has millions of moving parts. Changing the size of an economic part as integral as the minimum wage is likely to have far-reaching effects that even the most careful analysis fails to fully understand. Even if you disagree with the other side's stance, you might find that they bring a valuable perspective to the table.
But what do you think the minimum wage should be? Let everyone know by leaving a respectful comment below.