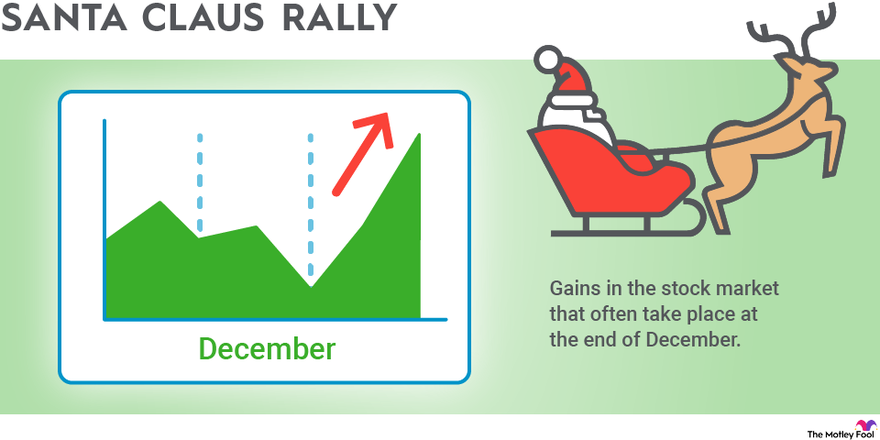
The Santa Claus rally refers to gains in the stock market that often take place at the end of December. The pattern is one of a number of "calendar effects" that occur, or at least are believed to occur, over the course of the year. It's not fully clear whether it's purely psychological or there are some underlying financial reasons for the year-end rally, but history has shown that stocks tend to gain at the end of the year and into the first days of January.
In this examination of the Santa Claus rally, we'll discuss the origins of the rally, why it happens, and the history behind it.
Understanding the Santa Claus rally
Generally, the Santa Claus rally refers to the stock market's history of rising over the last five trading days of the year and the first two market days of the new year.
Yale Hirsch first documented the pattern in 1972, writing in "Stock Trader's Almanac" that the S&P 500 had gained an average 1.5% during that seven-day period from 1950 through 1971. The pattern has held true since 1950, with the broad market index increasing an average of 1.3%. Additionally, the market has gained during those days in 34 of the previous 45 years, or more than 75% of the time.
To Hirsch, the Santa Claus rally wasn't just a clever name for a frequent occurrence but an indicator of the coming year for the stock market. In fact, that was where he saw value in tracking the rally, saying, “If Santa Claus should fail to call, bears may come to Broad and Wall,” a reference to the location of the New York Stock Exchange. Hirsch monitored three similar indicators as gauges for the next year's performance: the Santa Claus rally, the first five days of the market in the new year, and the January barometer, or the market's performance in the first month of the year. Of the three, the Santa Claus rally is the best known.
Causes of the Santa Claus rally
There isn't any clear cause for the Santa Claus rally, although there are number of possible reasons to explain stock market gains over the seven-day trading period. They include:
- Trading volume tends to be low since institutional investors take off the week after Christmas. The market can be more volatile and give more influence to retail investors, who tend to be more bullish.
- Investors buy stocks ahead of an anticipated rally in January, known as the January effect, which may come from reinvesting money after tax loss harvesting in December.
- Investors may already be reinvesting tax loss harvesting money at the end of December.
- The week between Christmas and New Year's can offer a hopeful and optimistic sense about the coming year.
- End-of-year bonuses and gifts during the holidays give people money to invest in the stock market.
- Once the Santa Claus rally is commonly known, it becomes a self-fulfilling prophecy. If people believe in it, they will invest accordingly.
History of the Santa Claus rally
In 2018, the S&P 500 finished the month with a 6.6% gain after December 24, which were the last four trading days of the month. Although the index fell on Jan. 3 -- the second day of the new year -- December 24 proved to be the market bottom.
Similarly in 2008, during the stock market crash caused by the financial crisis, stocks actually got a Santa Claus rally in the midst of a larger bear market rally. During the seven-day period, the S&P 500 gained 7.5%, although it would crash again in the first two months of 2009 before bottoming out on March 9.
In both 2008 and 2018, the Santa Claus rallies successfully predicted bull markets for the coming year. In 2009, the broad-market index gained 23%; in 2019, it rose 29%.
However, a Santa Claus rally isn't always an accurate predictor of gains the next year. In 2021, the S&P 500 gained 1.4% in the seven-day period, but the market peaked on Jan. 3 and entered a bear market in June, falling more than 20% as the Federal Reserve Board aggressively raised interest rates.
Since 1994, stocks have risen 23 times during the Santa Claus rally period. The following year has been positive for the S&P 500 18 times. Of the six times that stocks have fallen during the Santa Claus rally period, the market has fallen in four of the following years.
That makes the Santa Claus rally a surprisingly accurate market predictor.
Related stock market topics
The bottom line
Like other calendar effects, including the January effect and phrases such as, "Sell in May and go away," there is strong evidence that the Santa Claus rally is real and can predict the market's outcome.
Stocks usually rise over the last five days at the end of the year and the first two days of the following year. Based on the results since 1994, the behavior of stocks during the Santa Claus rally is also usually an accurate predictor of the direction of the stock market for the following year.
However, it's a mistake to confuse correlation for causality here. Just because the Santa Claus rally does usually happen, and it often predicts the market the following year, that doesn't mean it will continue to do so. Market sentiment can change. If investors anticipate it, they are likely to behave differently, and market participants may adjust according to the expectation of a Santa Claus rally.
Still, investors should be aware of how the market moves at different times of the year. Although there's no clear expectation for the Santa Claus rally, history has shown that stocks often outperform during the end-of-the-year period.
After Hirsch wrote about the pattern, it seemed to become part of the investing lexicon by the early 2000s when a number of references were made to the term in the financial media.
At times, the Santa Claus rally has proven strikingly prescient. For example, in 2018, the S&P 500 fell through much of the fourth quarter as Treasury yields rose. However, it hit bottom on December 24 and then surged.
Santa Claus rally FAQs
What days are the Santa Claus rally?
According to Yale Hirsch, who first noticed the trend of stocks gaining at the end of the year, the Santa Claus rally refers to stocks moving higher on the last five trading days of one year and the first two trading sessions of the next year.
However, market commentators will sometimes use the phrase to describe any rally that takes place around the end of December.
How long does the Santa Claus stock rally last?
By definition, the Santa Claus rally refers to gains in the market that typically happen in the last five days in one year and the first two days of the next. However, a Santa Claus rally could last longer. The term is sometimes used to refer to any rally that takes place around the end of the year.
Is the Santa Claus rally real?
Yes, the Santa Claus rally is real. Since 1950, the S&P 500 has gained an average of 1.3% during the seven-day period in which the rally takes place, and it's gained in 34 of the past 45 years. However, there is no clear cause for the Santa Claus rally, and there's no guarantee that it will continue. It's impossible to predict its future performance.


