Gladstone Land logo

Gladstone Land(NASDAQ) LAND

Market Cap$382.62MMarket cap calculated using publicly traded shares outstanding only. Does not include unlisted, private, or dual-class non-traded shares. Implied market cap may vary.
Since IPO (2013)+9%
5 Year-53%
1 Year+5%
1 Month-6%
Premium Feature
Moneyball Superscore
42/100
$8.89
+1.56%
+0.14Today
After hours$8.89-$0.00 (-0.06%)
Gladstone Land last closing stock price
MetricPriceDate
Last closeUSD 8.872026-10-23
Gladstone Land stock price return by period
PeriodPrice returnPrice at period startPeriod start date
1 week-3.91%USD 9.232026-10-16
1 month-6.43%USD 9.482026-09-23
3 month+5.72%USD 8.392026-07-24
Year to date+1.89%USD 8.712025-12-31
1 year+5.08%USD 8.442025-10-23
3 year-26.02%USD 11.992023-10-24
5 year-52.61%USD 18.722021-10-22
Since inception+9.42%USD 8.112013-01-29

Gladstone Land Financials at a Glance

Market Cap

$382.62MMarket cap calculated using publicly traded shares outstanding only. Does not include unlisted, private, or dual-class non-traded shares. Implied market cap may vary.

Revenue (TTM)

$88.48M

Net Income (TTM)

-$6.47M

EPS (TTM)

-$0.72

P/E Ratio

-12.40

Dividend

$0.61

Beta (Volatility)

0.79 (Low)

Price

$8.89

Volume

448

Open

$8.76

Previous Close

$8.87

Daily Range

$8.70 - $8.91

52-Week Range

$7.92 - $13.00

Estimated Earnings Date

Nov 4, 2026

LAND: Motley Fool Moneyball Superscore

42

Our CEO Is Handing Members His Secret Weapon

It's called Motley Fool Moneyball, our new proprietary AI tool

We spent over half a million dollars in R&D to build a tool that makes stock research faster, sharper, and smarter. Our analysts use it every day, and now, you can too.

Get Access Now

About Gladstone Land

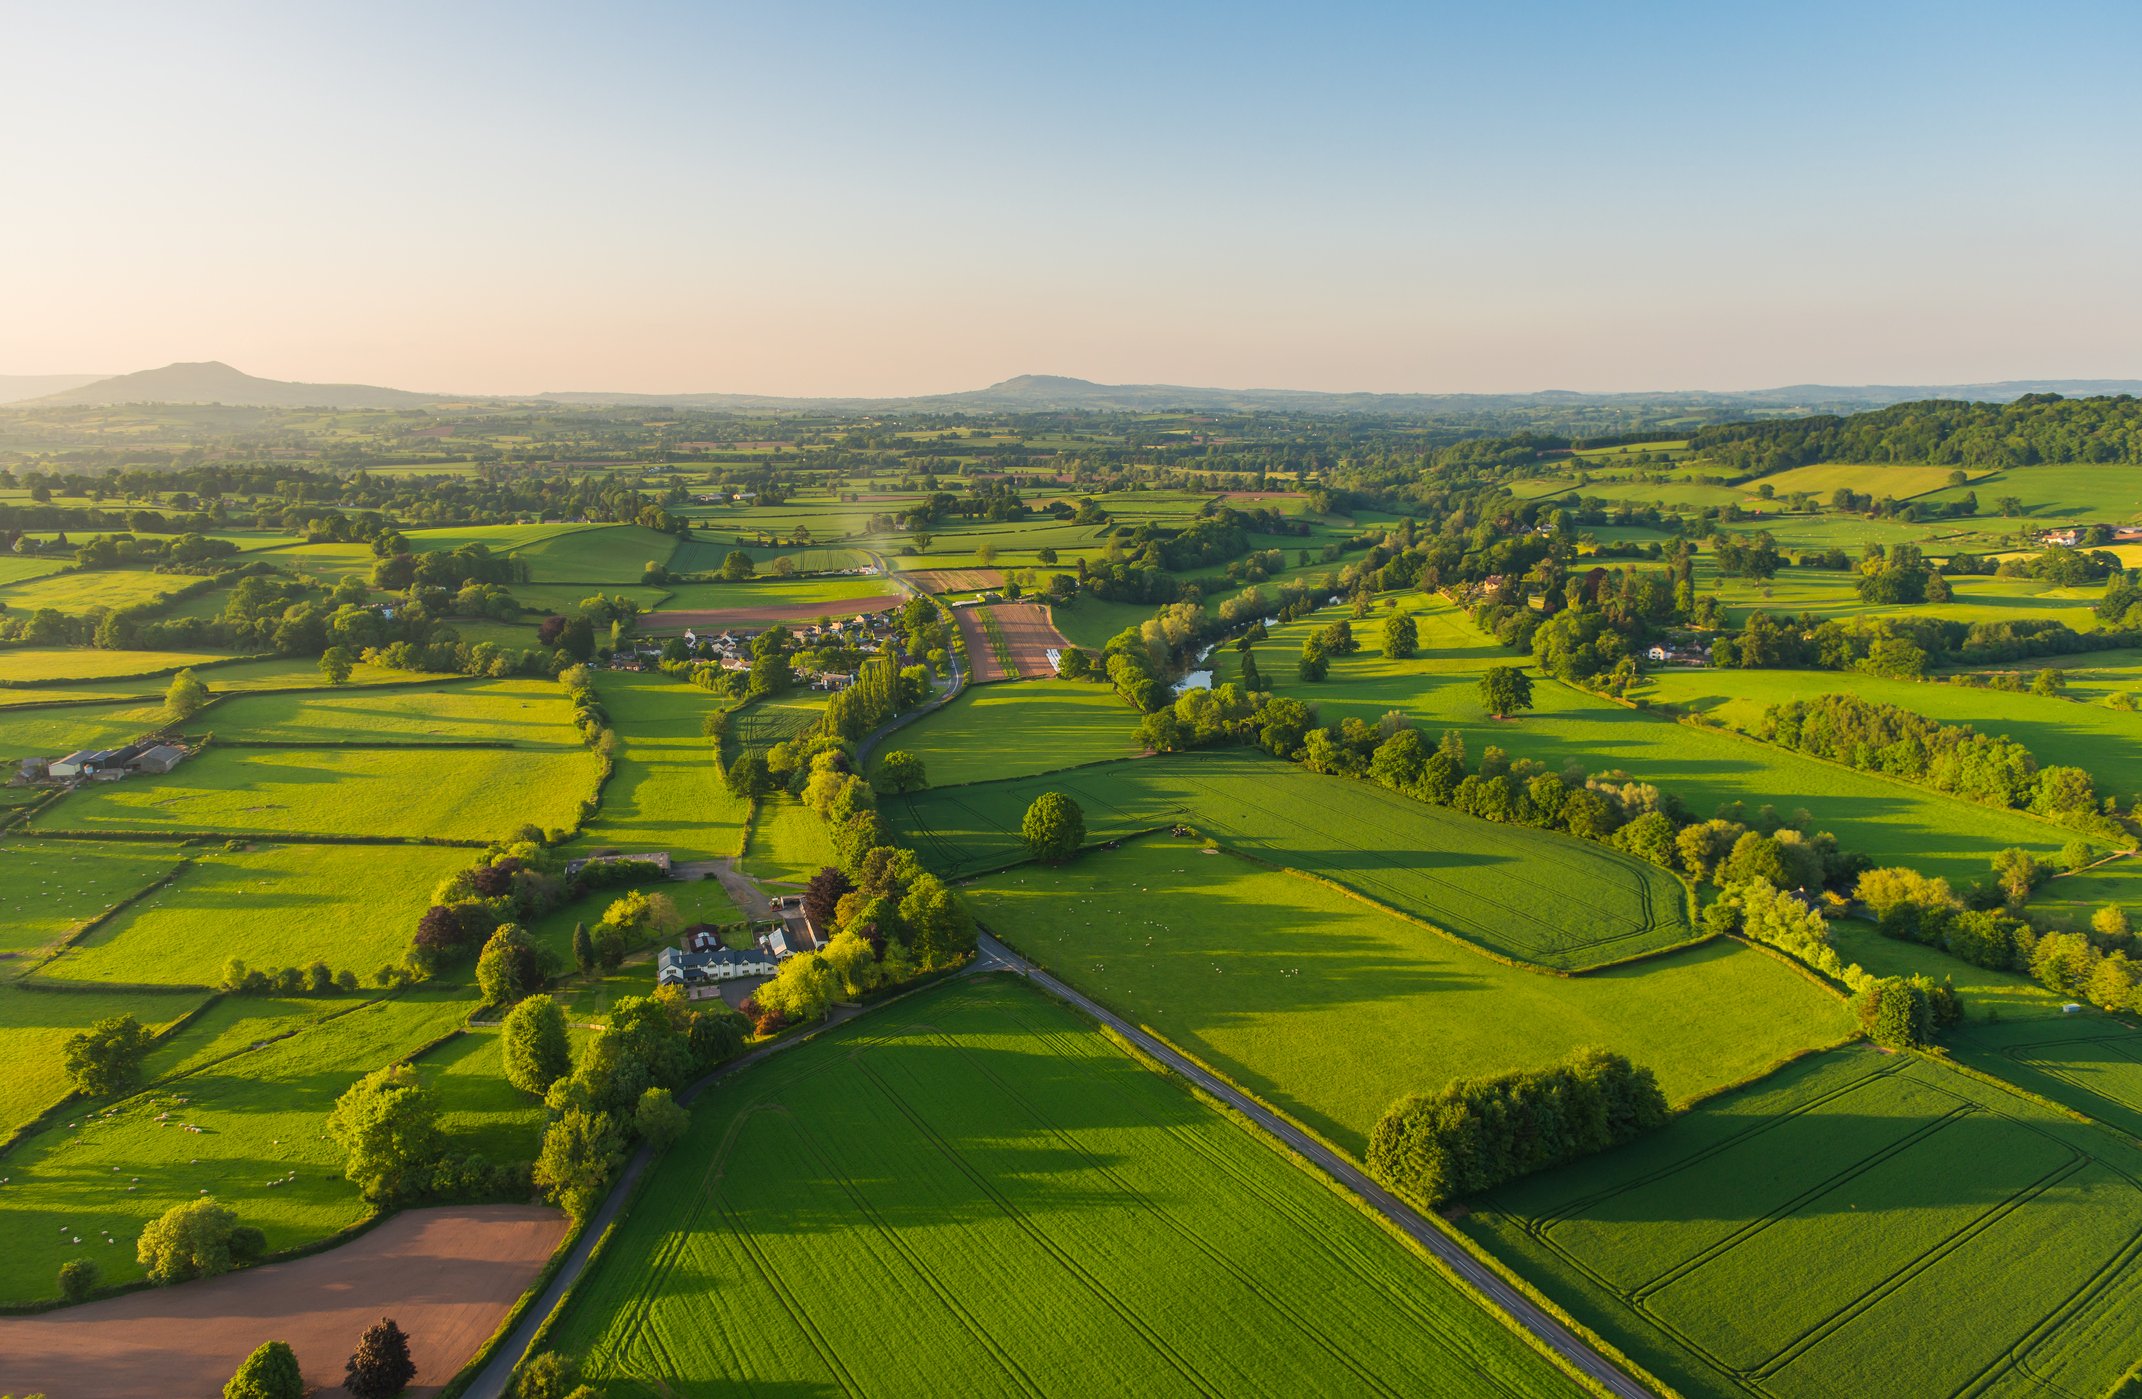
Gladstone Land Corporation NASDAQ:LAND owns farmland across the United States. It rents this land to farmers who grow food. This lets farmers work without the cost of ownership.

What Does the Company Own?

  • Fresh Produce Farmland: Land used for annual crops like berries and vegetables; often leased on a triple-net basis where tenants pay taxes, insurance, and maintenance.
  • Permanent Crop Farmland: Farms dedicated to crops like almonds, pistachios, and wine grapes; these typically produce harvests for 10 to over 20 years.
  • Agricultural Infrastructure: Buildings and facilities used for farming operations; includes cooling units, processing plants, and distribution centers.
  • Water Assets: Ownership of 55,649 acre-feet of water rights and infrastructure in California; an acre-foot is a unit of volume used for irrigation.

Recent Strategic Moves

  • Established a $37.0 million revolving line of credit with Farm Credit of Central Florida in April 2026.
  • Completed the sale of two farms in Florida totaling 617 acres for $3.2 million in July 2026.
  • Entered into equity distribution agreements in April 2026 to sell up to $500.0 million in common stock.
  • Launched a share repurchase program in July 2026 to buy back up to $55.0 million of preferred stock.
  • Repaid a $2.8 million loan in July 2026 that carried a 4.13% fixed interest rate.

Standing Out in the Field

Gladstone Land operates as a real estate investment trust (REIT), which is a company that owns income-producing property. It utilizes participation rents to earn extra income based on a percentage of the total revenue generated by its tenants.

Key Numbers to Know

  • Total lease revenue was $12.4 million for the three-month period ended June 30, 2026, up 0.5% year over year.
  • Net loss attributable to common stockholders reached $13.5 million for the three-month period ended June 30, 2026.
  • Fixed lease payments were $21.7 million for the six-month period ended June 30, 2026, down 16.9% year over year.
  • Participation rents were $5.1 million for the six-month period ended June 30, 2026, up 736.8% year over year.
  • Available liquidity was $124.4 million as of June 30, 2026, including cash and undrawn credit facility commitments.

The Bottom Line

Gladstone Land has grown into a diverse owner of nearly 100,000 acres of American farmland. Its focus on specialty crops and water rights supports its long-term role in the agricultural supply chain.

AI Generated • Aug 12, 2026

Industry

Specialized REITs

Employees

75

CEO

David J. Gladstone, MBA

Headquarters

McLean, VA 22102-3211, US

LAND Financials

Key Financial Metrics (TTM)

Gross Margin

-9.71%

Operating Margin

24.01%

Net Income Margin

-7.31%

Return on Equity

-0.96%

Return on Capital

1.99%

Return on Assets

-0.54%

Earnings Yield

-8.06%

Dividend Yield

6.84%

Payout Ratio

-7.11%

Stock Overview

Market Cap

$382.62MMarket cap calculated using publicly traded shares outstanding only. Does not include unlisted, private, or dual-class non-traded shares. Implied market cap may vary.

Shares Outstanding

43.14M

Volume

448

Avg. Volume

668.10K

Financials (TTM)

Gross Profit

-$8.59M

Operating Income

$21.25M

EBITDA

$50.57M

Operating Cash Flow

$27.80M

Capital Expenditure

-$3.00M

Free Cash Flow

$24.81M

Cash & ST Invst.

$22.55M

Total Debt

$492.06M

Gladstone Land Performance Analysis

Gladstone Land annual revenue and year-over-year revenue growth by fiscal year
Fiscal yearPeriod endRevenueYoY growth
20222022-12-31USD 89,236,00018.5%
20232023-12-31USD 90,398,0001.3%
20242024-12-31USD 85,216,000-5.7%
20252025-12-31USD 88,339,0003.7%
Gladstone Land sequential (quarter-over-quarter) revenue growth by fiscal quarter
Fiscal quarterPeriod endQoQ growth
Q32025-09-3044.6%
Q42025-12-31133.1%
Q12026-03-31-60.1%
Q22026-06-30-23.3%
Gladstone Land annual diluted earnings per share and year-over-year EPS growth by fiscal year
Fiscal yearPeriod endDiluted EPSYoY growth
20222022-12-31USD -0.4350.4%
20232023-12-31USD -0.28-36.5%
20242024-12-31USD -0.295.6%
20252025-12-31USD -0.29-1.3%
Gladstone Land sequential (quarter-over-quarter) diluted earnings per share growth by fiscal quarter
Fiscal quarterPeriod endQoQ growth
Q32025-09-3071.1%
Q42025-12-3154.5%
Q12026-03-31-380.0%
Q22026-06-30-33.3%

Revenue Growth Rate

Annual and quarterly growth comparison

Earnings Per Share Growth Rate

Annual and quarterly EPS growth comparison

Quarterly Performance

Name
Q2 2026YOY CHG

Revenue

$12.69M

+3.2%

Gross Profit

-$6.37M

+17.1%

Gross Margin

-50.21%

N/A

Market Cap

$382.62MMarket cap calculated using publicly traded shares outstanding only. Does not include unlisted, private, or dual-class non-traded shares. Implied market cap may vary.

N/A

Market Cap/Employee

$5.10M

N/A

Employees

75

N/A

Net Income

-$8.46M

-7.4%

EBITDA

$4.09M

-34.3%

Quarterly Fundamentals

Name
Q2 2026YOY CHG

Total Cash

$22.55M

-26.0%

Total Debt

$492.06M

-0.9%

Accounts Receivable

$0.00

N/A

Inventory

$6.53M

-54.9%

Long Term Debt

$480.73M

-3.1%

Short Term Debt

$11.33M

+5566.5%

Return on Assets

-0.54%

N/A

Return on Invested Capital

1.80%

N/A

Free Cash Flow

$19.70M

+1646.3%

Operating Cash Flow

$19.93M

+404.7%

Other Investments to Explore

People Also Watch

Symbol / CompanyPricePrice Chg
LNDBrasilAgro - Companhia Brasileira de Propriedades Agrícolas
$3.60+1.63%
FPIFarmland Partners Inc.
$10.25+2.50%
AGMFederal Agricultural Mortgage
$199.64-0.88%

Trending Stocks

Symbol / CompanyPricePrice Chg
HYGiShares Trust - iShares iBoxx $ High Yieldorate Bond ETF
$77.05-0.07%
EWZiShares - iShares Msci Brazil ETF
$42.59+1.77%
NUNu Holdings
$15.16+2.92%
SOXLDirexion Shares ETF Trust - Direxion Daily Semiconductor Bull 3x ETF
$83.56+1.77%

Questions About LAND

What is the current price of Gladstone Land?

Gladstone Land is trading at $8.87 per share.

What is the 52-week range for Gladstone Land?

Over the past 52 weeks, Gladstone Land has traded between $7.92 and $13.00.

How much debt does Gladstone Land have?

As of the most recent reporting period, Gladstone Land reported total debt of $492.06M.

How much cash does Gladstone Land have on hand?

Gladstone Land reported $22.55M in cash and cash equivalents in its most recent financial results.

What is Gladstone Land’s dividend yield?

Gladstone Land currently has a dividend yield of 6.84%.

Premium Investing Services

Invest better with The Motley Fool. Get stock recommendations, portfolio guidance, and more from The Motley Fool's premium services.