Accessibility Menu
Dutch Bros logo

Dutch Bros(NYSE) BROS

Market Cap$10.85BMarket cap calculated using publicly traded shares outstanding only. Does not include unlisted, private, or dual-class non-traded shares. Implied market cap may vary.
Since IPO (2021)+79%
5 YearN/A
1 Year+11%
1 Month-10%
$65.88
+0.69%
+0.45Today
Pre market$66.76+$0.88 (+1.34%)
Dutch Bros last closing stock price
MetricPriceDate
Last closeUSD 65.832026-07-31
Dutch Bros stock price return by period
PeriodPrice returnPrice at period startPeriod start date
1 week+2.86%USD 64.002026-07-24
1 month-10.2%USD 73.312026-07-01
3 month+15.59%USD 56.952026-05-01
Year to date+7.53%USD 61.222025-12-31
1 year+11.07%USD 59.272025-07-31
3 year+113.66%USD 30.812023-08-01
Since inception+79.47%USD 36.682021-09-15

Dutch Bros Financials at a Glance

Market Cap

$10.85BMarket cap calculated using publicly traded shares outstanding only. Does not include unlisted, private, or dual-class non-traded shares. Implied market cap may vary.

Revenue (TTM)

$1.75B

Net Income (TTM)

$80.59M

EPS (TTM)

$0.63

P/E Ratio

103.85

Dividend

$0.00

Beta (Volatility)

0.00 (Low)

Price

$65.88

Volume

1,731.358

Open

$65.69

Previous Close

$65.83

Daily Range

$65.45 - $67.02

52-Week Range

$44.58 - $74.65

Estimated Earnings Date

Aug 5, 2026

About Dutch Bros

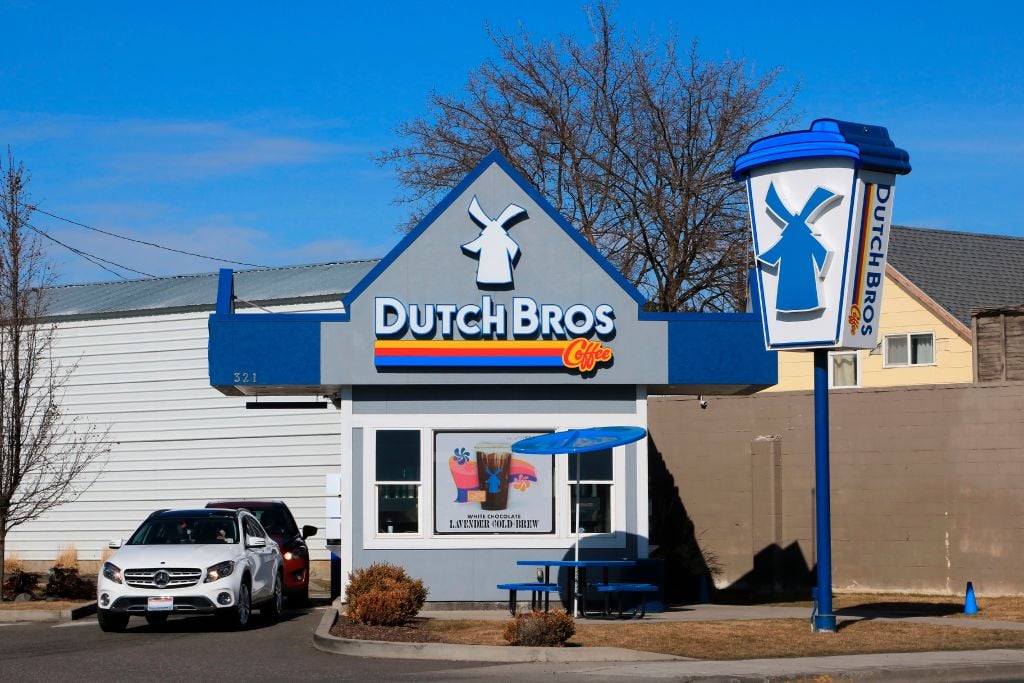
Dutch Bros sells customizable coffee and energy drinks through small drive-thru shops. This helps busy people get high-quality beverages quickly without leaving their cars. The company uses a friendly service model to connect with local neighborhoods across the United States.

What Is on the Menu?

  • Coffee: Hand-crafted espresso shots, blended coffee drinks, and cold brews made with private-label beans; accounted for approximately 50% of 2025 sales.
  • Energy: Proprietary Dutch Bros Rebel energy drinks that customers can customize with various fruit flavors; represented approximately 25% of 2025 sales.
  • Refreshments and Other: Teas, lemonades, smoothies, and sodas alongside a limited selection of snacks; contributed the remaining 25% of 2025 sales.
  • Customization Pantry: Add-on modifiers including protein milk, boba, and sugar-free syrups used to tailor drinks to specific dietary needs.

How the Brand is Growing

  • Opened a new roasting facility in Melissa, Texas during 2024 to increase supply chain resilience for eastward expansion.
  • Launched order ahead functionality within the Dutch Rewards mobile app in 2024 to increase customer convenience and morning throughput.
  • Expanded the shop network to 1,136 total locations across 25 states by the end of 2025, primarily through new company-operated sites.
  • Introduced a plan to expand food offerings in 2026 to capture more morning customer visits.

What Makes Dutch Bros Different

The company relies on a unique labor model where regional operators are recruited exclusively from an internal pool of experienced employees. This strategy preserves a specific culture of speed and service while scaling into new geographic markets.

The Recent Financial Story

  • Revenue reached $443.6 million in Q4 2025, up 29.4% from the $342.8 million reported in Q4 2024.
  • Operating income rose to $34 million in Q4 2025, a 115.2% increase compared to $15.8 million in the previous year.
  • Net income climbed to $21.4 million in Q4 2025, up from $3.6 million in Q4 2024.
  • Dutch Rewards transactions grew to 72% of all sales in 2025, compared to 68% in 2024.
  • Free cash flow was $8.5 million in Q4 2025, down 56.5% from $19.5 million in Q4 2024.

Bottom Line

Dutch Bros has transformed from a single pushcart into a major drive-thru beverage chain with over 1,000 locations. Its focus on internal leadership and digital loyalty has helped it shift from a regional franchise to a national company-operated brand.

AI Generated • Apr 22, 2026

Industry

Hotels, Restaurants and Leisure

Employees

32,000

CEO

Christine Barone, MBA

Headquarters

Tempe, AZ 85281, US

BROS Financials

Key Financial Metrics (TTM)

Gross Margin

25.18%

Operating Margin

9.50%

Net Income Margin

4.61%

Return on Equity

12.07%

Return on Capital

9.11%

Return on Assets

2.60%

Earnings Yield

0.96%

Dividend Yield

0.00%

Payout Ratio

0.00%

Stock Overview

Market Cap

$10.85BMarket cap calculated using publicly traded shares outstanding only. Does not include unlisted, private, or dual-class non-traded shares. Implied market cap may vary.

Shares Outstanding

127.29M

Volume

1.73K

Avg. Volume

3.61M

Financials (TTM)

Gross Profit

$440.00M

Operating Income

$166.02M

EBITDA

$265.14M

Operating Cash Flow

$343.39M

Capital Expenditure

-$252.58M

Free Cash Flow

$90.80M

Cash & ST Invst.

$263.52M

Total Debt

$1.16B

Dutch Bros Performance Analysis

Dutch Bros annual revenue and year-over-year revenue growth by fiscal year
Fiscal yearPeriod endRevenueYoY growth
20222022-12-31USD 739,012,00048.4%
20232023-12-31USD 965,776,00030.7%
20242024-12-31USD 1,281,015,00032.6%
20252025-12-31USD 1,638,159,00027.9%
Dutch Bros sequential (quarter-over-quarter) revenue growth by fiscal quarter
Fiscal quarterPeriod endQoQ growth
Q22025-06-3017.1%
Q32025-09-301.9%
Q42025-12-314.7%
Q12026-03-314.7%
Dutch Bros annual diluted earnings per share and year-over-year EPS growth by fiscal year
Fiscal yearPeriod endDiluted EPSYoY growth
20222022-12-31USD -0.09-64.0%
20232023-12-31USD 0.03N/A
20242024-12-31USD 0.341122.4%
20252025-12-31USD 0.6387.5%
Dutch Bros sequential (quarter-over-quarter) diluted earnings per share growth by fiscal quarter
Fiscal quarterPeriod endQoQ growth
Q22025-06-3053.8%
Q32025-09-30-30.0%
Q42025-12-3121.4%
Q12026-03-31-23.5%

Revenue Growth Rate

Annual and quarterly growth comparison

Earnings Per Share Growth Rate

Annual and quarterly EPS growth comparison

Quarterly Performance

Name
Q1 2026YOY CHG

Revenue

$464.41M

+30.8%

Gross Profit

$106.05M

+17.8%

Gross Margin

22.83%

N/A

Market Cap

$10.85BMarket cap calculated using publicly traded shares outstanding only. Does not include unlisted, private, or dual-class non-traded shares. Implied market cap may vary.

N/A

Market Cap/Employee

$338.99K

N/A

Employees

32,000

N/A

Net Income

$16.10M

+4.8%

EBITDA

$50.59M

-12.0%

Quarterly Fundamentals

Name
Q1 2026YOY CHG

Total Cash

$263.52M

-16.7%

Total Debt

$1.16B

+13.6%

Accounts Receivable

$18.77M

+61.3%

Inventory

$37.39M

-2.2%

Long Term Debt

$1.12B

+15.2%

Short Term Debt

$43.04M

-16.0%

Return on Assets

2.60%

N/A

Return on Invested Capital

5.83%

N/A

Free Cash Flow

$27.72M

+419.9%

Operating Cash Flow

$84.72M

+129.7%

Other Investments to Explore

People Also Watch

Symbol / CompanyPricePrice Chg
MGMMGM Resorts International
$44.57-2.39%
FIVEFive Below, Inc.
$217.13-0.93%
ALVAutoliv, Inc.
$123.17-0.80%
BWABorgWarner Inc.
$63.74-1.04%

Trending Stocks

Symbol / CompanyPricePrice Chg
FCUVFocus Universal
$11.60+5.17%
MUUDirexion Shares ETF Trust - Direxion Daily Mu Bull 2x Shares
$23.67-0.12%
TQQQProShares Trust - ProShares UltraPro Qqq
$64.62+0.02%
INTCIntel
$90.20-0.01%

Questions About BROS

What is the current price of Dutch Bros?

Dutch Bros is trading at $65.83 per share.

What is the 52-week range for Dutch Bros?

Over the past 52 weeks, Dutch Bros has traded between $44.58 and $74.65.

How much debt does Dutch Bros have?

As of the most recent reporting period, Dutch Bros reported total debt of $1.16B.

How much cash does Dutch Bros have on hand?

Dutch Bros reported $263.52M in cash and cash equivalents in its most recent financial results.

What is Dutch Bros’s dividend yield?

Dutch Bros does not currently have a dividend yield.

Premium Investing Services

Invest better with The Motley Fool. Get stock recommendations, portfolio guidance, and more from The Motley Fool's premium services.