Accessibility Menu
Ginkgo Bioworks logo

Ginkgo Bioworks(NYSE) DNA

Market Cap$496.06MMarket cap calculated using publicly traded shares outstanding only. Does not include unlisted, private, or dual-class non-traded shares. Implied market cap may vary.
Since IPO (2021)-98%
5 Year-98%
1 Year-35%
1 Month+2%
$7.37
-4.41%
-0.34Today
Ginkgo Bioworks last closing stock price
MetricPriceDate
Last closeUSD 7.712026-08-19
Ginkgo Bioworks stock price return by period
PeriodPrice returnPrice at period startPeriod start date
1 week+6.93%USD 7.212026-08-12
1 month+2.12%USD 7.552026-07-20
3 month-4.58%USD 8.082026-05-21
Year to date-7.22%USD 8.312025-12-31
1 year-35.43%USD 11.942025-08-19
3 year-88.1%USD 64.802023-08-18
5 year-98.06%USD 398.002021-08-20
Since inception-98.1%USD 404.802021-04-19

Ginkgo Bioworks Financials at a Glance

Market Cap

$496.06MMarket cap calculated using publicly traded shares outstanding only. Does not include unlisted, private, or dual-class non-traded shares. Implied market cap may vary.

Revenue (TTM)

$111.86M

Net Income (TTM)

-$290.80M

EPS (TTM)

-$5.44

P/E Ratio

-1.42

Dividend

$0.00

Beta (Volatility)

2.56 (High)

Price

$7.37

Volume

562,658.689

Open

$7.45

Previous Close

$7.71

Daily Range

$7.29 - $7.65

52-Week Range

$5.37 - $17.58

Estimated Earnings Date

Nov 5, 2026

DNA: Motley Fool Moneyball Superscore

38

Our CEO Is Handing Members His Secret Weapon

It's called Motley Fool Moneyball, our new proprietary AI tool

We spent over half a million dollars in R&D to build a tool that makes stock research faster, sharper, and smarter. Our analysts use it every day, and now, you can too.

Get Access Now

About Ginkgo Bioworks

Ginkgo Bioworks Holdings, Inc. helps companies design custom cells. These cells help companies make new medicines and better crops. The company sells research services and robotic tools to customers.

How Does Ginkgo Engineering Work?

  • Cell Engineering Solutions: Multiyear research projects that deliver custom biological parts, such as enzyme sequences or engineered cell lines; includes service fees and royalty rights.
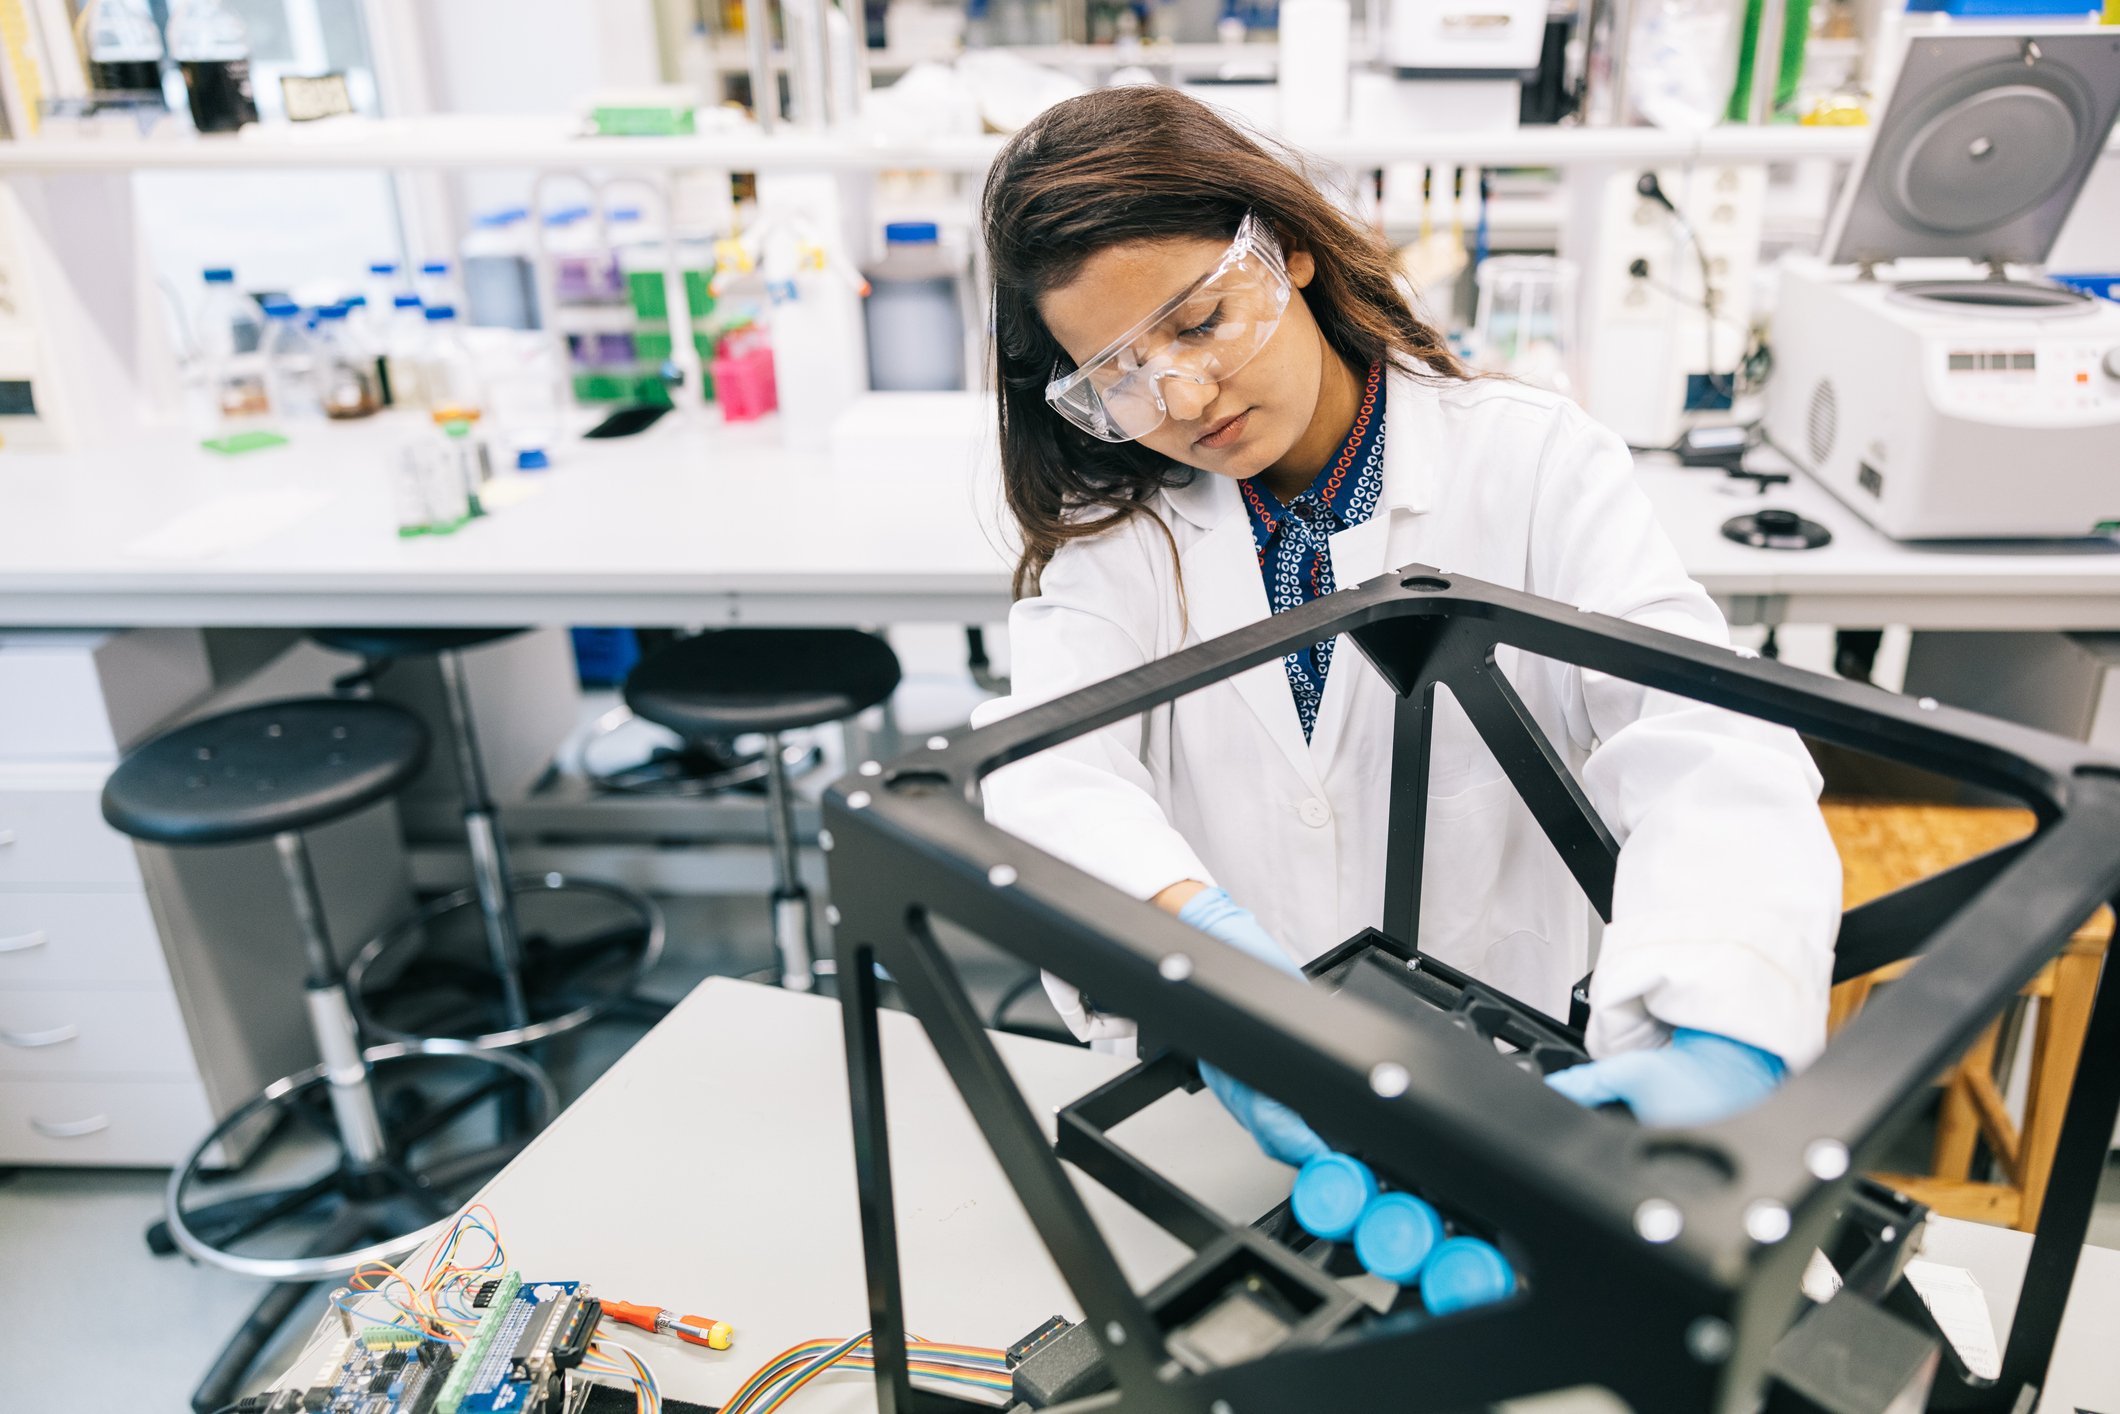
  • Cell Engineering Tools: Robotic automation systems and data packages sold to customers who want to conduct their own biological research in-house.
  • Autonomous Lab: Robotic hardware systems that generate large-scale data for biological modeling and design using generative artificial intelligence tools.
  • Genetic Medicine R&D: Specialized research services including protein engineering and bioprocess development for healthcare and agricultural industries.

Adapting to a Changing Market

  • Divested the Biosecurity business on April 3, 2026, to focus resources on core cell engineering and technology tools.
  • Launched a major restructuring plan in the second quarter of 2024 to reduce costs and prioritize the development of laboratory automation systems.
  • Established a stock sale program in Sept. 2025 to raise up to $100.0 million for corporate purposes and technology development.
  • Expanded service offerings in 2024 to include technology tools that allow customers to use the company’s automation and data directly.

The Power of Data

Ginkgo uses automated robotic systems to run many biological experiments at the same time. These systems generate data sets that improve the success rate and speed of future cell designs.

Checking the Ledger

  • Revenue was $39.6 million for the six months ended June 30, 2026, down from $77.4 million year over year.
  • The net loss from continuing operations was $133.4 million for the six months ended June 30, 2026.
  • Cash, cash equivalents, and marketable securities totaled $302.2 million as of June 30, 2026.
  • Research and development expenses fell to $96.1 million for the six months ended June 30, 2026, down from $124.3 million year over year.
  • Net proceeds from the stock sale agreement reached $34.6 million as of June 30, 2026.

The Long-Term Path

Ginkgo is shifting its focus toward providing standardized technology tools and reducing high operational costs. Its recent divestitures and restructuring efforts reflect a strategy to streamline its business model for future sustainability.

AI Generated • Aug 7, 2026

Industry

Life Sciences Tools and Services

Employees

485

CEO

Jason Kelly, PhD

Headquarters

Boston, MA 02210, US

DNA Financials

Key Financial Metrics (TTM)

Gross Margin

80.09%

Operating Margin

-259.86%

Net Income Margin

-259.96%

Return on Equity

-60.21%

Return on Capital

-33.24%

Return on Assets

-29.37%

Earnings Yield

-70.42%

Dividend Yield

0.00%

Payout Ratio

0.00%

Stock Overview

Market Cap

$496.06MMarket cap calculated using publicly traded shares outstanding only. Does not include unlisted, private, or dual-class non-traded shares. Implied market cap may vary.

Shares Outstanding

64.34M

Volume

562.66K

Avg. Volume

1.16M

Financials (TTM)

Gross Profit

$89.60M

Operating Income

-$290.69M

EBITDA

-$209.15M

Operating Cash Flow

-$170.24M

Capital Expenditure

-$19.88M

Free Cash Flow

-$190.12M

Cash & ST Invst.

$302.16M

Total Debt

$404.11M

Ginkgo Bioworks Performance Analysis

Ginkgo Bioworks annual revenue and year-over-year revenue growth by fiscal year
Fiscal yearPeriod endRevenueYoY growth
20222022-12-31USD 477,706,00052.2%
20232023-12-31USD 251,455,000-47.4%
20242024-12-31USD 227,043,000-9.7%
20252025-12-31USD 170,155,000-25.1%
Ginkgo Bioworks sequential (quarter-over-quarter) revenue growth by fiscal quarter
Fiscal quarterPeriod endQoQ growth
Q32025-09-30-21.7%
Q42025-12-31-14.0%
Q12026-03-31-41.7%
Q22026-06-303.5%
Ginkgo Bioworks annual diluted earnings per share and year-over-year EPS growth by fiscal year
Fiscal yearPeriod endDiluted EPSYoY growth
20222022-12-31USD -50.157.0%
20232023-12-31USD -18.37-63.4%
20242024-12-31USD -10.54-42.6%
20252025-12-31USD -5.64-46.5%
Ginkgo Bioworks sequential (quarter-over-quarter) diluted earnings per share growth by fiscal quarter
Fiscal quarterPeriod endQoQ growth
Q32025-09-30-31.8%
Q42025-12-311.4%
Q12026-03-312.8%
Q22026-06-3046.0%

Revenue Growth Rate

Annual and quarterly growth comparison

Earnings Per Share Growth Rate

Annual and quarterly EPS growth comparison

Quarterly Performance

Name
Q2 2026YOY CHG

Revenue

$20.16M

-59.4%

Gross Profit

$18.44M

-47.0%

Gross Margin

91.47%

N/A

Market Cap

$496.06MMarket cap calculated using publicly traded shares outstanding only. Does not include unlisted, private, or dual-class non-traded shares. Implied market cap may vary.

N/A

Market Cap/Employee

$1.02M

N/A

Employees

485

N/A

Net Income

-$46.71M

+22.5%

EBITDA

-$44.36M

+3.7%

Quarterly Fundamentals

Name
Q2 2026YOY CHG

Total Cash

$302.16M

-36.2%

Total Debt

$404.11M

-5.8%

Accounts Receivable

$13.01M

-43.7%

Inventory

$0.00

N/A

Long Term Debt

$404.11M

-5.8%

Short Term Debt

$0.00

N/A

Return on Assets

-29.37%

N/A

Return on Invested Capital

-31.69%

N/A

Free Cash Flow

-$46.89M

-16.4%

Operating Cash Flow

-$44.27M

-10.0%

Other Investments to Explore

People Also Watch

Symbol / CompanyPricePrice Chg
ARVNArvinas, Inc.
$9.20-5.01%
VALNValneva SE
$6.84+0.00%
REPLReplimune Group, Inc.
$14.17-4.32%
AVBPArriVent BioPharma, Inc.
$28.90-3.73%

Trending Stocks

Symbol / CompanyPricePrice Chg
BITOProShares Trust - ProShares Bitcoin ETF
$9.77+0.06%
IBITiShares Bitcoin Trust
$40.92+0.06%
SPCXSpace Exploration Technologies
$130.55-0.07%
MRNAModerna
$139.48-0.20%

Questions About DNA

What is the current price of Ginkgo Bioworks?

Ginkgo Bioworks is trading at $7.34 per share.

What is the 52-week range for Ginkgo Bioworks?

Over the past 52 weeks, Ginkgo Bioworks has traded between $5.37 and $17.58.

How much debt does Ginkgo Bioworks have?

As of the most recent reporting period, Ginkgo Bioworks reported total debt of $404.11M.

How much cash does Ginkgo Bioworks have on hand?

Ginkgo Bioworks reported $87.45M in cash and cash equivalents in its most recent financial results.

What is Ginkgo Bioworks’s dividend yield?

Ginkgo Bioworks does not currently have a dividend yield.

Premium Investing Services

Invest better with The Motley Fool. Get stock recommendations, portfolio guidance, and more from The Motley Fool's premium services.