Accessibility Menu
American Electric Power logo

American Electric Power

(NASDAQ) AEP

Current Price$132.14
Market Cap$71.90BMarket cap calculated using publicly traded shares outstanding only. Does not include unlisted, private, or dual-class non-traded shares. Implied market cap may vary.
Since IPO (1968)+13,576%
5 Year+81%
1 Year+29%
1 Month+3%
American Electric Power last closing stock price
MetricPriceDate
Last closeUSD 132.142026-07-17
American Electric Power stock price return by period
PeriodPrice returnPrice at period startPeriod start date
1 week-2.43%USD 135.432026-07-10
1 month+3.02%USD 128.272026-06-17
3 month-0.42%USD 132.702026-04-17
Year to date+16.34%USD 113.582025-12-31
1 year+28.69%USD 102.682025-07-17
3 year+74.38%USD 75.782023-07-18
5 year+80.93%USD 73.042021-07-16
Since inception+13,576%USD 0.971968-01-02

American Electric Power Financials at a Glance

Market Cap

$71.90BMarket cap calculated using publicly traded shares outstanding only. Does not include unlisted, private, or dual-class non-traded shares. Implied market cap may vary.

Revenue (TTM)

$22.16B

Net Income (TTM)

$3.65B

EPS (TTM)

$6.76

P/E Ratio

19.54

Dividend

$3.78

Beta (Volatility)

0.30 (Low)

Price

$132.14

Volume

4,315,019

Open

$135.39

Previous Close

$132.14

Daily Range

$131.78 - $135.67

52-Week Range

$105.70 - $140.58

Estimated Earnings Date

Jul 30, 2026

AEP: Motley Fool Moneyball Superscore

73

Our CEO Is Handing Members His Secret Weapon

It's called Motley Fool Moneyball, our new proprietary AI tool

We spent over half a million dollars in R&D to build a tool that makes stock research faster, sharper, and smarter. Our analysts use it every day, and now, you can too.

Get Access Now

About American Electric Power

American Electric Power helps millions of people by keeping their lights on and their homes warm. The company makes, moves, and sells electricity across several U.S. states. This energy powers everything from small local houses to large factories and data centers.

The Power Portfolio

  • Vertically Integrated Utilities: Owns and operates the full process of making and delivering electricity through subsidiaries like Appalachian Power and Indiana Michigan Power.
  • Transmission and Distribution: Focuses on the wires and poles that carry power to customers in Ohio and Texas.
  • AEP Transmission Holdco: Invests in high-voltage lines through state-specific companies and joint ventures to improve the regional power grid.
  • Generation and Marketing: Sells electricity in competitive markets and manages energy for large commercial and industrial clients.

Recent Strategic Moves

  • Acquired Diversion in December 2024, adding 201 megawatts of wind power generation in Texas.
  • Partnered with Kohlberg Kravis Roberts and Co. and Public Sector Pension Investment Board in June 2025 to sell a 19.9% stake in Midwest Transmission Holdings.
  • Formed a joint venture named Gigawatt AI to build an artificial intelligence operating system specifically for utility companies.
  • Expanded the North Central Wind Energy Facilities in Oklahoma, which includes the Sundance, Maverick, and Traverse projects.

What Makes the System Work

The company manages one of the largest electricity transmission systems in the United States, spanning 11 different states. Its operations are heavily regulated by state and federal commissions, which ensures a steady framework for recovering the costs of building new power plants and lines.

Financial Performance by the Numbers

  • Total revenue reached $5 billion in Q4 2025, a 7.3% increase from the previous year.
  • Free cash flow rose to $3.9 billion in Q4 2025, up 598.9% from Q4 2024.
  • Operating income was $920.9 million in Q4 2025, down 16.2% compared to the same period in 2024.
  • Net income for Q4 2025 was $582 million, a 12.4% decrease from Q4 2024.
  • The company maintained a workforce of 17,581 employees as of December 31, 2025.

The Bottom Line

American Electric Power has transitioned from a traditional utility into a major developer of high-voltage transmission and renewable energy projects. This evolution centers on modernizing the power grid while shifting its energy mix toward natural gas and wind power.

AI Generated • Apr 18, 2026

Industry

Electric Utilities

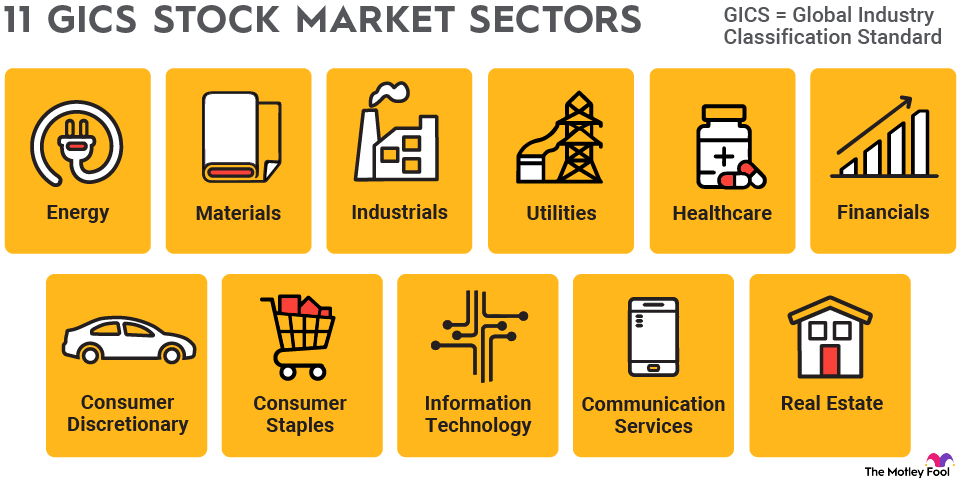
Sector

Utilities

Employees

17,581

CEO

William J. Fehrman, MBA

Headquarters

Columbus, OH 43215-2373, US

AEP Financials

Key Financial Metrics (TTM)

Gross Margin

40.39%

Operating Margin

23.47%

Net Income Margin

16.49%

Return on Equity

11.86%

Return on Capital

6.51%

Return on Assets

3.10%

Earnings Yield

5.12%

Dividend Yield

2.86%

Payout Ratio

55.48%

Stock Overview

Market Cap

$71.90BMarket cap calculated using publicly traded shares outstanding only. Does not include unlisted, private, or dual-class non-traded shares. Implied market cap may vary.

Shares Outstanding

544.11M

Volume

4.32M

Avg. Volume

4.88M

Financials (TTM)

Gross Profit

$8.95B

Operating Income

$5.20B

EBITDA

$8.70B

Operating Cash Flow

$7.01B

Capital Expenditure

$641.50M

Free Cash Flow

$7.65B

Cash & ST Invst.

$549.00M

Total Debt

$51.78B

American Electric Power Performance Analysis

American Electric Power annual revenue and year-over-year revenue growth by fiscal year
Fiscal yearPeriod endRevenueYoY growth
20222022-12-31USD 19,314,600,00016.2%
20232023-12-31USD 19,381,500,0000.3%
20242024-12-31USD 19,916,500,0002.8%
20252025-12-31USD 21,783,000,0009.4%
American Electric Power sequential (quarter-over-quarter) revenue growth by fiscal quarter
Fiscal quarterPeriod endQoQ growth
Q22025-06-30-9.8%
Q32025-09-3018.1%
Q42025-12-31-16.0%
Q12026-03-3119.3%
American Electric Power annual diluted earnings per share and year-over-year EPS growth by fiscal year
Fiscal yearPeriod endDiluted EPSYoY growth
20222022-12-31USD 4.49-9.4%
20232023-12-31USD 4.24-5.5%
20242024-12-31USD 5.5831.6%
20252025-12-31USD 6.6619.3%
American Electric Power sequential (quarter-over-quarter) diluted earnings per share growth by fiscal quarter
Fiscal quarterPeriod endQoQ growth
Q22025-06-3052.7%
Q32025-09-30-21.0%
Q42025-12-31-40.9%
Q12026-03-3149.5%

Revenue Growth Rate

Annual and quarterly growth comparison

Earnings Per Share Growth Rate

Annual and quarterly EPS growth comparison

Quarterly Performance

Name
Q1 2026YOY CHG

Revenue

$6.02B

+6.8%

Gross Profit

$3.90B

+107.6%

Gross Margin

64.82%

N/A

Market Cap

$71.90BMarket cap calculated using publicly traded shares outstanding only. Does not include unlisted, private, or dual-class non-traded shares. Implied market cap may vary.

N/A

Market Cap/Employee

$4.09M

N/A

Employees

17,581

N/A

Net Income

$874.00M

+9.2%

EBITDA

$2.13B

-4.1%

Quarterly Fundamentals

Name
Q1 2026YOY CHG

Total Cash

$549.00M

+18.4%

Total Debt

$51.78B

+10.3%

Accounts Receivable

$2.97B

+13.4%

Inventory

$1.67B

+5.2%

Long Term Debt

$47.42B

+20.6%

Short Term Debt

$4.35B

-42.8%

Return on Assets

3.10%

N/A

Return on Invested Capital

4.95%

N/A

Free Cash Flow

-$1.32B

-93.0%

Operating Cash Flow

$1.52B

+4.8%

Other Investments to Explore

People Also Watch

Symbol / CompanyPricePrice Chg
DDominion Energy, Inc.
$71.06-0.88%
SRESempra
$92.24-0.98%
NGGNational Grid plc
$83.99+1.79%
VSTVistra Corp.
$155.44+1.89%

Trending Stocks

Symbol / CompanyPricePrice Chg
ONDSOndas
$6.53-0.02%
AALAmerican Airlines Group
$14.98-0.04%
NVDANvidia
$202.81-0.02%
NOKNokia
$10.12-0.03%

Questions About AEP

What is the current price of American Electric Power?

American Electric Power is trading at $132.14 per share.

What is the 52-week range for American Electric Power?

Over the past 52 weeks, American Electric Power has traded between $105.70 and $140.58.

How much debt does American Electric Power have?

As of the most recent reporting period, American Electric Power reported total debt of $51.78B.

How much cash does American Electric Power have on hand?

American Electric Power reported $339.00M in cash and cash equivalents in its most recent financial results.

What is American Electric Power’s dividend yield?

American Electric Power currently has a dividend yield of 2.86%.

Premium Investing Services

Invest better with The Motley Fool. Get stock recommendations, portfolio guidance, and more from The Motley Fool's premium services.