Accessibility Menu
AXT logo

AXT(NASDAQ) AXTI

Market Cap$5.80BMarket cap calculated using publicly traded shares outstanding only. Does not include unlisted, private, or dual-class non-traded shares. Implied market cap may vary.
Since IPO (1998)+607%
5 Year+806%
1 Year+4,200%
1 Month+47%
$88.55
+17.80%
+13.38Today
After hours$90.32+$1.77 (+2.00%)
AXT last closing stock price
MetricPriceDate
Last closeUSD 88.582026-08-07
AXT stock price return by period
PeriodPrice returnPrice at period startPeriod start date
1 week+46.58%USD 60.432026-07-31
1 month+47.34%USD 60.122026-07-08
3 month-23.87%USD 116.362026-05-08
Year to date+441.77%USD 16.352025-12-31
1 year+4,200%USD 2.062025-08-07
3 year+3,205.22%USD 2.682023-08-08
5 year+805.73%USD 9.782021-08-06
Since inception+607.48%USD 10.631998-05-21

AXT Financials at a Glance

Market Cap

$5.80BMarket cap calculated using publicly traded shares outstanding only. Does not include unlisted, private, or dual-class non-traded shares. Implied market cap may vary.

Revenue (TTM)

$125.51M

Net Income (TTM)

$4.05M

EPS (TTM)

$0.02

P/E Ratio

4589.64

Dividend

$0.00

Beta (Volatility)

1.96 (High)

Price

$88.55

Volume

19,172,811.826

Open

$79.14

Previous Close

$88.58

Daily Range

$78.50 - $89.49

52-Week Range

$2.05 - $143.16

Estimated Earnings Date

Oct 29, 2026

AXTI: Motley Fool Moneyball Superscore

52

Our CEO Is Handing Members His Secret Weapon

It's called Motley Fool Moneyball, our new proprietary AI tool

We spent over half a million dollars in R&D to build a tool that makes stock research faster, sharper, and smarter. Our analysts use it every day, and now, you can too.

Get Access Now

About AXT

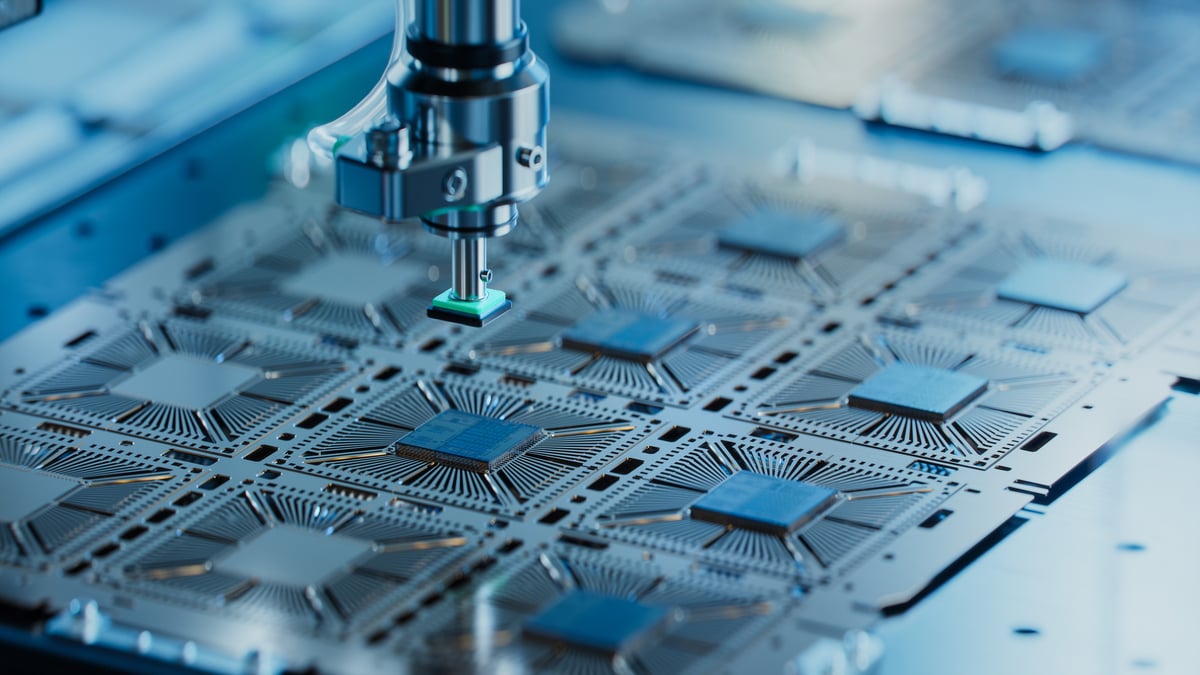
AXT makes special wafers that help power fast internet and advanced electronics. Its products are used in data centers, 5G networks, and solar panels. These wafers help companies build faster, more efficient technology for everyday use.

Wafers, Wires, and Wonders: What AXT Sells

  • Indium Phosphide Substrates (InP): Used in data center lasers, 5G, and fiber optics; part of the substrate segment (67% of 2025 revenue).
  • Gallium Arsenide Substrates (GaAs): Used in Wi-Fi, IoT, LEDs, and sensors; part of substrate segment (67% of 2025 revenue).
  • Germanium Substrates (Ge): Used in satellite solar cells and infrared detectors; included in substrate segment.
  • Raw Materials: Purified gallium, boron trioxide, and alloys for making wafers; 33% of 2025 revenue.
  • pBN Crucibles and Parts: Tools for crystal growth in wafer production; supports manufacturing process.

Growth Spurts and Global Moves

  • Expanded manufacturing in Beijing, Dingxing, and Kazuo, China (2023–2025).
  • Launched pilot production of larger wafers (6-inch InP, 8-inch GaAs) in 2025.
  • Raised $100 million in a Nasdaq equity offering in December 2025.
  • Ongoing process to list Beijing Tongmei Xtal Technology on Shanghai STAR Market (2025).
  • Invested in recycling programs for InP and GaAs wafers since 2024.

Why AXT Stands Out in the Crowd

AXT controls its supply chain by owning raw material sources in China, reducing costs and delays. Its proprietary crystal growth technology creates wafers with fewer defects, supporting high-performance electronics. The company’s broad product range and global sales network help it serve diverse technology markets.

Five Things You Need to Know

  • Revenue was $88.3 million in 2025, down 11.1% from 2024.
  • Substrate products made up 67% of 2025 revenue; raw materials 33%.
  • International sales were 98% of total revenue in 2025.
  • Gross margin fell to 12.7% in 2025 from 24.0% in 2024.
  • Net loss was $21.3 million in 2025, up from $11.6 million in 2024.

Bottom Line

AXT has evolved by diversifying products and expanding manufacturing in China. Its focus on specialty wafers and supply chain control supports its role in global electronics.

AI Generated • Apr 16, 2026

Industry

Semiconductors and Semiconductor Equipment

Employees

1,072

CEO

Morris S. Young, PhD

Headquarters

Fremont, CA 94538, US

AXTI Financials

Key Financial Metrics (TTM)

Gross Margin

32.18%

Operating Margin

3.09%

Net Income Margin

3.23%

Return on Equity

1.00%

Return on Capital

-6.50%

Return on Assets

0.37%

Earnings Yield

0.02%

Dividend Yield

0.00%

Payout Ratio

0.00%

Stock Overview

Market Cap

$5.80BMarket cap calculated using publicly traded shares outstanding only. Does not include unlisted, private, or dual-class non-traded shares. Implied market cap may vary.

Shares Outstanding

65.42M

Volume

19.17M

Avg. Volume

10.17M

Financials (TTM)

Gross Profit

$40.39M

Operating Income

$3.88M

EBITDA

$16.89M

Operating Cash Flow

-$21.12M

Capital Expenditure

-$6.86M

Free Cash Flow

-$27.98M

Cash & ST Invst.

$417.20M

Total Debt

$85.40M

AXT Performance Analysis

AXT annual revenue and year-over-year revenue growth by fiscal year
Fiscal yearPeriod endRevenueYoY growth
20222022-12-31USD 141,118,0002.7%
20232023-12-31USD 75,795,000-46.3%
20242024-12-31USD 99,361,00031.1%
20252025-12-31USD 88,326,000-11.1%
AXT sequential (quarter-over-quarter) revenue growth by fiscal quarter
Fiscal quarterPeriod endQoQ growth
Q32025-09-3055.5%
Q42025-12-31-17.6%
Q12026-03-3116.9%
Q22026-06-3076.8%
AXT annual diluted earnings per share and year-over-year EPS growth by fiscal year
Fiscal yearPeriod endDiluted EPSYoY growth
20222022-12-31USD 0.378.6%
20232023-12-31USD -0.42N/A
20242024-12-31USD -0.27-35.4%
20252025-12-31USD -0.4978.4%
AXT sequential (quarter-over-quarter) diluted earnings per share growth by fiscal quarter
Fiscal quarterPeriod endQoQ growth
Q32025-09-3072.2%
Q42025-12-31-80.7%
Q12026-03-3161.2%
Q22026-06-30676.9%

Revenue Growth Rate

Annual and quarterly growth comparison

Earnings Per Share Growth Rate

Annual and quarterly EPS growth comparison

Quarterly Performance

Name
Q2 2026YOY CHG

Revenue

$47.59M

+164.8%

Gross Profit

$21.37M

+1391.0%

Gross Margin

44.90%

N/A

Market Cap

$5.80BMarket cap calculated using publicly traded shares outstanding only. Does not include unlisted, private, or dual-class non-traded shares. Implied market cap may vary.

N/A

Market Cap/Employee

$5.41M

N/A

Employees

1,072

N/A

Net Income

$11.13M

+258.8%

EBITDA

$15.13M

+426.6%

Quarterly Fundamentals

Name
Q2 2026YOY CHG

Total Cash

$417.20M

+1444.8%

Total Debt

$85.40M

+46.8%

Accounts Receivable

$36.68M

+60.9%

Inventory

$96.32M

+20.3%

Long Term Debt

$1.16M

-32.1%

Short Term Debt

$84.23M

+49.1%

Return on Assets

0.37%

N/A

Return on Invested Capital

0.40%

N/A

Free Cash Flow

-$13.06M

-238.6%

Operating Cash Flow

-$11.68M

-249.2%

Other Investments to Explore

People Also Watch

Symbol / CompanyPricePrice Chg
LPTHLightPath Technologies, Inc.
$13.06+8.74%
NVECNVE Corporation
$125.94-2.70%
RPAYRepay Holdings Corporation
$3.95-1.00%
BKKTBakkt Holdings, Inc.
$7.53+5.76%

Trending Stocks

Symbol / CompanyPricePrice Chg
SPCXSpace Exploration Technologies
$133.11+0.16%
TTDThe Trade Desk
$13.80-0.22%
NVDANvidia
$223.96+0.02%
TLTiShares Trust - iShares 20+ Year Treasury Bond ETF
$82.76+0.00%

Questions About AXTI

What is the current price of AXT?

AXT is trading at $88.58 per share.

What is the 52-week range for AXT?

Over the past 52 weeks, AXT has traded between $2.05 and $143.16.

How much debt does AXT have?

As of the most recent reporting period, AXT reported total debt of $85.40M.

How much cash does AXT have on hand?

AXT reported $445.22M in cash and cash equivalents in its most recent financial results.

What is AXT’s dividend yield?

AXT does not currently have a dividend yield.

Premium Investing Services

Invest better with The Motley Fool. Get stock recommendations, portfolio guidance, and more from The Motley Fool's premium services.