Accessibility Menu
TMC The Metals Company logo

TMC The Metals Company(NASDAQ) TMC

Market Cap$1.75BMarket cap calculated using publicly traded shares outstanding only. Does not include unlisted, private, or dual-class non-traded shares. Implied market cap may vary.
Since IPO (2020)-59%
5 YearN/A
1 Year-16%
1 Month+7%
$3.85
-3.15%
-0.13Today
TMC The Metals Company last closing stock price
MetricPriceDate
Last closeUSD 3.972026-08-19
TMC The Metals Company stock price return by period
PeriodPrice returnPrice at period startPeriod start date
1 week-11.19%USD 4.472026-08-12
1 month+6.72%USD 3.722026-07-20
3 month-24.52%USD 5.262026-05-21
Year to date-35.66%USD 6.172025-12-31
1 year-15.89%USD 4.722025-08-19
3 year+230.83%USD 1.202023-08-18
Since inception-59.07%USD 9.702020-06-26

TMC The Metals Company Financials at a Glance

Market Cap

$1.75BMarket cap calculated using publicly traded shares outstanding only. Does not include unlisted, private, or dual-class non-traded shares. Implied market cap may vary.

Revenue (TTM)

$0.00

Net Income (TTM)

-$305.64M

EPS (TTM)

-$0.74

P/E Ratio

-5.38

Dividend

$0.00

Beta (Volatility)

1.51 (High)

Price

$3.85

Volume

1,866,632.19

Open

$3.92

Previous Close

$3.97

Daily Range

$3.76 - $3.93

52-Week Range

$3.40 - $11.35

Estimated Earnings Date

Nov 12, 2026

About TMC The Metals Company

TMC the metals company Inc. finds metal rocks on the ocean floor. These rocks help make batteries for electric cars. The company provides materials needed for clean energy.

Mining Without Digging

  • Nickel: Essential material for electric vehicle batteries and high-purity metal products.
  • Copper: Mineral used for electric vehicle wiring, energy transmission, and industrial applications.
  • Cobalt: Key component in energy storage markets and refined battery materials.
  • Manganese: Processed into silicate products for steel production or silicomanganese alloys.

Steps Toward Commercial Production

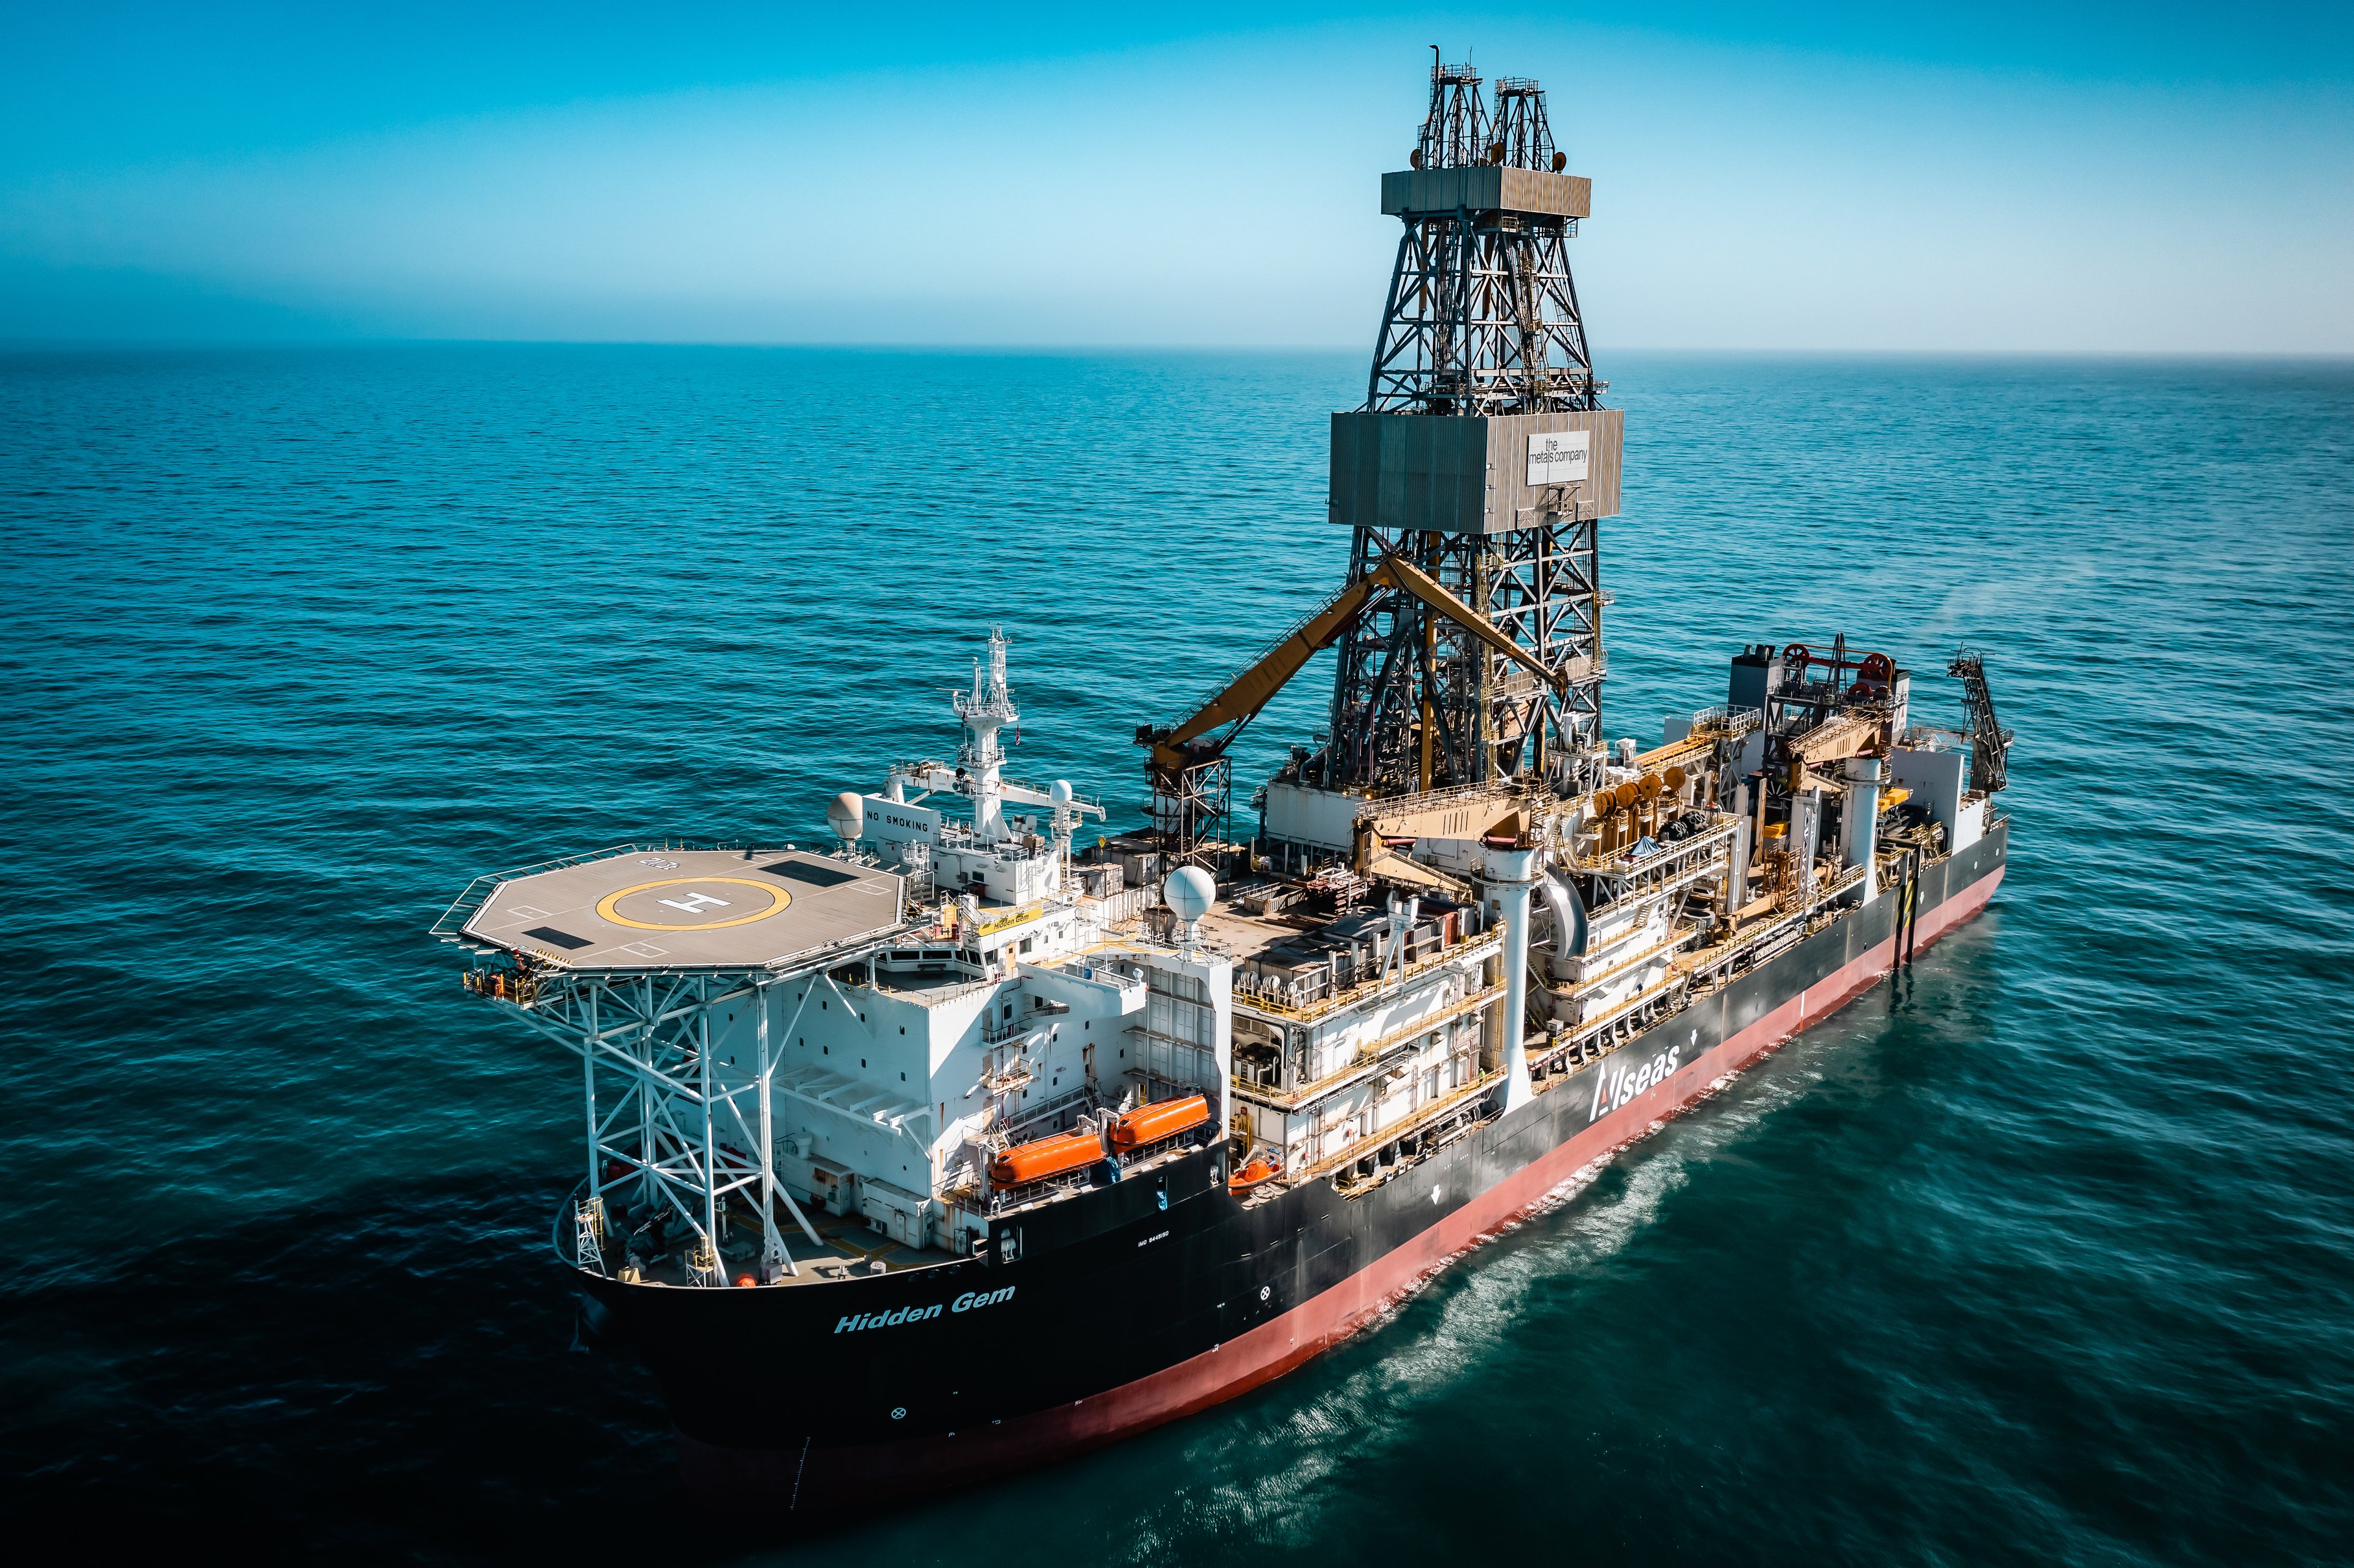
  • Signed a commercial agreement with Allseas on May 11, 2026, to develop the first offshore nodule recovery system.
  • Executed a services agreement with Mariana Minerals Co. on July 21, 2026, for a proposed Texas-based processing plant.
  • Obtained a five-year exploration contract extension from the International Seabed Authority on July 20, 2026.
  • Partnered with Korea Zinc in June 2025 to advance deep-sea mineral refining and development in the United States.
  • Demonstrated economic viability for its primary project area in a pre-feasibility study released on August 4, 2025.

Collecting Rather Than Mining

The company uses a near-zero solid waste flowsheet, which is a technical design for processing minerals without creating traditional mining waste. This system focuses on collecting polymetallic nodules, which are metal-rich rocks that sit unattached on the ocean floor.

Measuring Development Progress

  • Net loss was $60.1 million for the three months ended June 30, 2026, compared to $74.3 million in the same period of 2025.
  • Cash on hand totaled $98.7 million as of June 30, 2026.
  • Accumulated deficit reached $1,032 million from inception through June 30, 2026.
  • Market capitalization was $1.9 billion as of the second quarter of 2026.
  • Exploration and evaluation expenses were $56.1 million for the quarter ended June 30, 2026.

A New Frontier for Metals

The company has transitioned from exploration to a development phase focused on regulatory approval and commercial systems. Its strategy centers on establishing a domestic supply of minerals required for electric vehicles and global energy storage.

AI Generated • Aug 14, 2026

Industry

Metals and Mining

Sector

Materials

Employees

48

CEO

Gerard Barron

Headquarters

Vancouver, BC V6E 2J3, CA

TMC Financials

Key Financial Metrics (TTM)

Gross Margin

0.00%

Operating Margin

0.00%

Net Income Margin

0.00%

Return on Equity

948.80%

Return on Capital

N/A

Return on Assets

-168.99%

Earnings Yield

-18.59%

Dividend Yield

0.00%

Payout Ratio

0.00%

Stock Overview

Market Cap

$1.75BMarket cap calculated using publicly traded shares outstanding only. Does not include unlisted, private, or dual-class non-traded shares. Implied market cap may vary.

Shares Outstanding

441.13M

Volume

1.87M

Avg. Volume

5.33M

Financials (TTM)

Gross Profit

-$157.00K

Operating Income

-$205.76M

EBITDA

-$302.46M

Operating Cash Flow

-$43.56M

Capital Expenditure

-$193.00K

Free Cash Flow

-$43.72M

Cash & ST Invst.

$98.66M

Total Debt

$0.00

TMC The Metals Company Performance Analysis

TMC The Metals Company annual revenue and year-over-year revenue growth by fiscal year
Fiscal yearPeriod endRevenueYoY growth
20222022-12-31USD 0N/A
20232023-12-31USD 0N/A
20242024-12-31USD 0N/A
20252025-12-31USD 0N/A
TMC The Metals Company sequential (quarter-over-quarter) revenue growth by fiscal quarter
Fiscal quarterPeriod endQoQ growth
Q32025-09-30N/A
Q42025-12-31N/A
Q12026-03-31N/A
Q22026-06-30N/A
TMC The Metals Company annual diluted earnings per share and year-over-year EPS growth by fiscal year
Fiscal yearPeriod endDiluted EPSYoY growth
20222022-12-31USD -0.713.4%
20232023-12-31USD -0.26-64.1%
20242024-12-31USD -0.25-0.4%
20252025-12-31USD -0.83226.7%
TMC The Metals Company sequential (quarter-over-quarter) diluted earnings per share growth by fiscal quarter
Fiscal quarterPeriod endQoQ growth
Q32025-09-30-185.0%
Q42025-12-3183.2%
Q12026-03-3149.3%
Q22026-06-30-189.3%

Revenue Growth Rate

Annual and quarterly growth comparison

Currently no data to display.

Earnings Per Share Growth Rate

Annual and quarterly EPS growth comparison

Quarterly Performance

Name
Q2 2026YOY CHG

Revenue

$0.00

N/A

Gross Profit

-$39.00K

N/A

Gross Margin

0.00%

N/A

Market Cap

$1.75BMarket cap calculated using publicly traded shares outstanding only. Does not include unlisted, private, or dual-class non-traded shares. Implied market cap may vary.

N/A

Market Cap/Employee

$36.49M

N/A

Employees

48

N/A

Net Income

-$60.12M

+19.1%

EBITDA

-$59.33M

+19.2%

Quarterly Fundamentals

Name
Q2 2026YOY CHG

Total Cash

$98.66M

-14.8%

Total Debt

$0.00

-100.0%

Accounts Receivable

$2.75M

+81.2%

Inventory

$0.00

N/A

Long Term Debt

$0.00

N/A

Short Term Debt

$0.00

-100.0%

Return on Assets

-1.69%

N/A

Return on Invested Capital

-1.60%

N/A

Free Cash Flow

-$20.10M

-87.6%

Operating Cash Flow

-$20.10M

-88.5%

Other Investments to Explore

People Also Watch

Symbol / CompanyPricePrice Chg
TGLSTecnoglass Inc.
$40.53-0.87%
USARUSA Rare Earth Inc
$17.02-5.92%
TTAMTitan America S.A.
$14.99-1.35%
BCCBoise Cascade Company
$81.58-1.86%

Trending Stocks

Symbol / CompanyPricePrice Chg
BITOProShares Trust - ProShares Bitcoin ETF
$9.78+0.06%
IBITiShares Bitcoin Trust
$40.97+0.06%
SPCXSpace Exploration Technologies
$131.29-0.06%
TSLLDirexion Shares ETF Trust - Direxion Daily Tsla Bull 2x ETF
$8.87-0.03%

Questions About TMC

What is the current price of TMC The Metals Company?

TMC The Metals Company is trading at $3.85 per share.

What is the 52-week range for TMC The Metals Company?

Over the past 52 weeks, TMC The Metals Company has traded between $3.40 and $11.35.

How much debt does TMC The Metals Company have?

As of the most recent reporting period, TMC The Metals Company reported total debt of $145.00M.

How much cash does TMC The Metals Company have on hand?

TMC The Metals Company reported $98.66M in cash and cash equivalents in its most recent financial results.

What is TMC The Metals Company’s dividend yield?

TMC The Metals Company does not currently have a dividend yield.

Premium Investing Services

Invest better with The Motley Fool. Get stock recommendations, portfolio guidance, and more from The Motley Fool's premium services.