Accessibility Menu
Peabody Energy logo

Peabody Energy

(NYSE) BTU

Current Price$22.45
Market Cap$2.73BMarket cap calculated using publicly traded shares outstanding only. Does not include unlisted, private, or dual-class non-traded shares. Implied market cap may vary.
Since IPO (2017)-16%
5 Year+169%
1 Year+42%
1 Month-13%
Peabody Energy last closing stock price
MetricPriceDate
Last closeUSD 22.442026-07-17
Peabody Energy stock price return by period
PeriodPrice returnPrice at period startPeriod start date
1 week-3.98%USD 23.372026-07-10
1 month-12.55%USD 25.662026-06-17
3 month-12.24%USD 25.572026-04-17
Year to date-24.04%USD 29.542025-12-31
1 year+41.58%USD 15.852025-07-17
3 year+9.11%USD 20.572023-07-18
5 year+169.33%USD 8.332021-07-16
Since inception-16.32%USD 26.822017-04-03

Peabody Energy Financials at a Glance

Market Cap

$2.73BMarket cap calculated using publicly traded shares outstanding only. Does not include unlisted, private, or dual-class non-traded shares. Implied market cap may vary.

Revenue (TTM)

$3.90B

Net Income (TTM)

-$119.70M

EPS (TTM)

-$0.98

P/E Ratio

-22.81

Dividend

$0.30

Beta (Volatility)

0.88 (Low)

Price

$22.45

Volume

2,137,843

Open

$22.68

Previous Close

$22.44

Daily Range

$22.16 - $22.80

52-Week Range

$14.25 - $41.14

Estimated Earnings Date

Jul 30, 2026

BTU: Motley Fool Moneyball Superscore

51

Our CEO Is Handing Members His Secret Weapon

It's called Motley Fool Moneyball, our new proprietary AI tool

We spent over half a million dollars in R&D to build a tool that makes stock research faster, sharper, and smarter. Our analysts use it every day, and now, you can too.

Get Access Now

About Peabody Energy

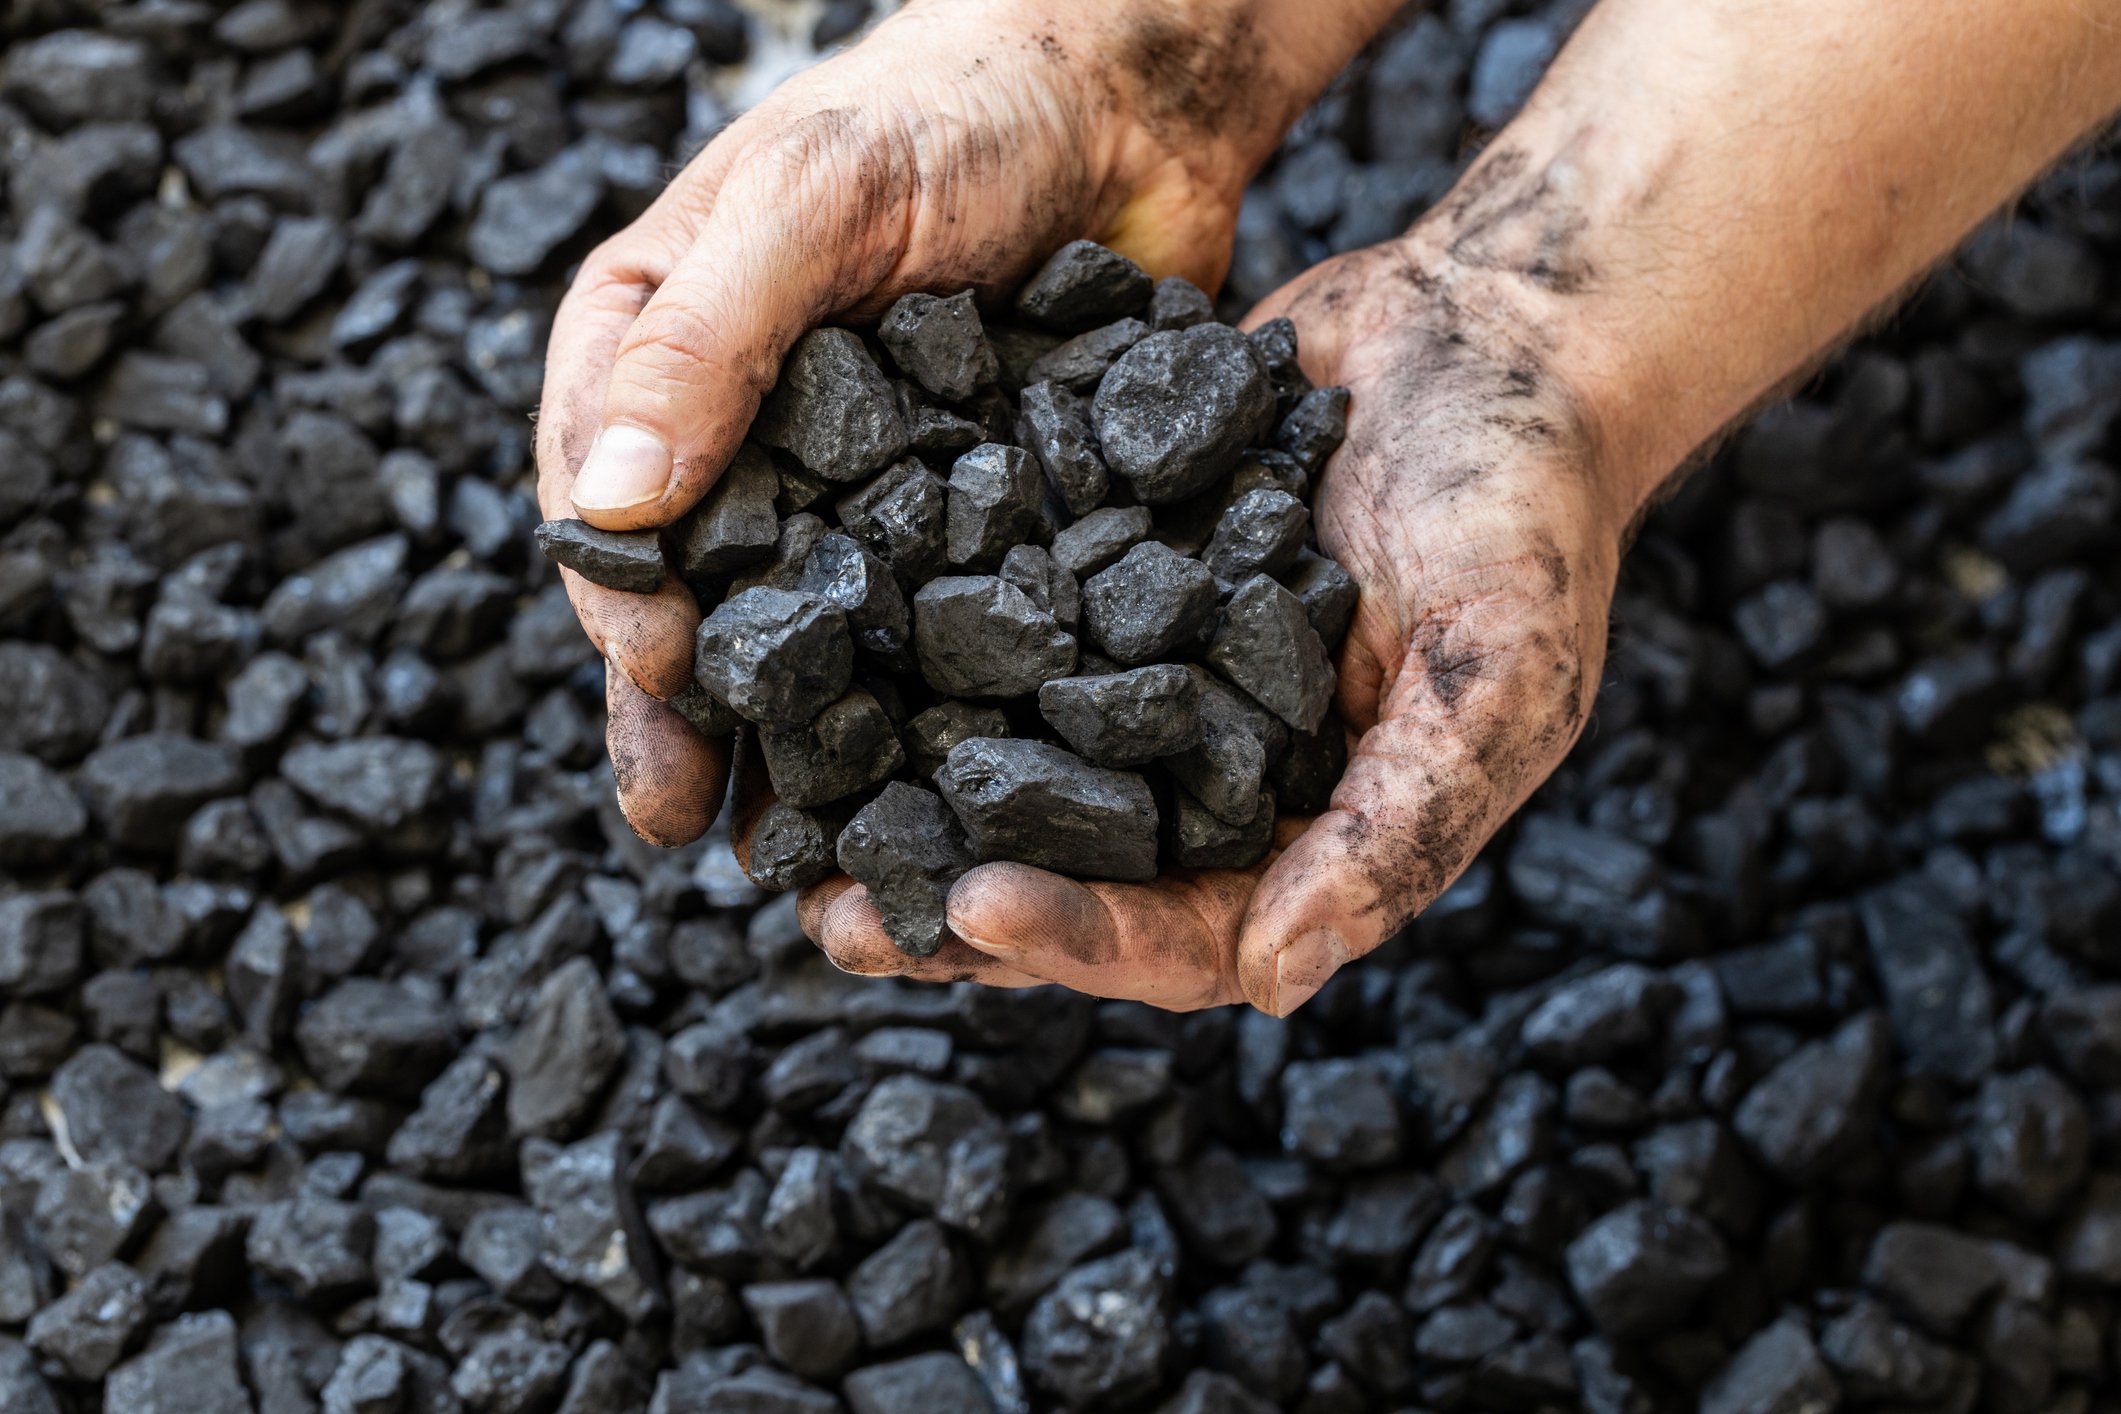
Peabody helps power plants and steel mills get the fuel they need to operate. The company digs up coal from mines in the United States and Australia. These products are used to make electricity for homes and produce steel for buildings.

What Peabody Digs and Delivers

  • Powder River Basin: Thermal coal mined in Wyoming for electricity generation; represents 49% of revenue when combined with other U.S. thermal operations.
  • Seaborne Metallurgical: Specialized coal used by steel manufacturers; accounts for approximately 51% of revenue when grouped with seaborne thermal sales.
  • Seaborne Thermal: High-quality coal shipped to international power plants; sold primarily through annual and multi-year supply agreements.
  • Other U.S. Thermal: Bituminous and sub-bituminous coal from mines in Indiana, Illinois, New Mexico, and Colorado.

Recent Business Moves

  • Started full-scale production at the Centurion Mine in Queensland, Australia, in February 2026 to increase metallurgical coal output.
  • Advanced renewable energy projects on reclaimed mining lands during 2025 as part of an asset optimization program.
  • Evaluated potential for rare earth elements (REE) and critical minerals (CM) within existing coal reserves throughout 2025.
  • Integrated benefits from the One Big Beautiful Bill Act of 2025, which reduced federal coal royalty rates and added tax credits for steel-making coal.

A Global Mining Footprint

Peabody manages 16 active mining operations across two continents and serves customers in over 10 countries, including Japan, China, and India. The company maintains its own transportation network through rail, barge, and export terminal contracts to reach global markets.

The Latest Financial Facts

  • Revenue was $1.0 billion in Q4 2025, down 9.0% from $1.1 billion in Q4 2024.
  • Net income reached $10.4 million in Q4 2025, down 66.0% year-over-year.
  • Operating cash flow rose to $231.4 million in Q4 2025, up 93.2% from the previous year.
  • Free cash flow hit $125.4 million in Q4 2025, up from a loss of $10.5 million in Q4 2024.

The Evolution of Peabody

Peabody has shifted its focus toward seaborne metallurgical coal while optimizing its traditional thermal coal assets in the U.S. and Australia. The company is currently exploring new revenue streams through land reclamation, renewable energy, and critical mineral extraction.

AI Generated • Apr 23, 2026

Industry

Oil, Gas and Consumable Fuels

Sector

Energy

Employees

5,400

CEO

James C. Grech, MBA

Headquarters

Saint Louis, MO 63101-1826, US

BTU Financials

Key Financial Metrics (TTM)

Gross Margin

6.68%

Operating Margin

-2.34%

Net Income Margin

-3.07%

Return on Equity

-3.37%

Return on Capital

0.01%

Return on Assets

-2.10%

Earnings Yield

-4.38%

Dividend Yield

1.34%

Payout Ratio

-30.58%

Stock Overview

Market Cap

$2.73BMarket cap calculated using publicly traded shares outstanding only. Does not include unlisted, private, or dual-class non-traded shares. Implied market cap may vary.

Shares Outstanding

121.80M

Volume

2.14M

Avg. Volume

3.23M

Financials (TTM)

Gross Profit

$260.30M

Operating Income

-$91.40M

EBITDA

$333.20M

Operating Cash Flow

$554.90M

Capital Expenditure

-$434.90M

Free Cash Flow

$120.00M

Cash & ST Invst.

$492.50M

Total Debt

$429.60M

Peabody Energy Performance Analysis

Peabody Energy annual revenue and year-over-year revenue growth by fiscal year
Fiscal yearPeriod endRevenueYoY growth
20222022-12-31USD 5,462,100,00057.3%
20232023-12-31USD 4,868,600,000-10.9%
20242024-12-31USD 4,236,700,000-13.0%
20252025-12-31USD 3,861,500,000-8.9%
Peabody Energy sequential (quarter-over-quarter) revenue growth by fiscal quarter
Fiscal quarterPeriod endQoQ growth
Q22025-06-30-5.0%
Q32025-09-3013.7%
Q42025-12-311.0%
Q12026-03-31-4.8%
Peabody Energy annual diluted earnings per share and year-over-year EPS growth by fiscal year
Fiscal yearPeriod endDiluted EPSYoY growth
20222022-12-31USD 8.25156.6%
20232023-12-31USD 5.00-39.4%
20242024-12-31USD 2.70-46.0%
20252025-12-31USD -0.43N/A
Peabody Energy sequential (quarter-over-quarter) diluted earnings per share growth by fiscal quarter
Fiscal quarterPeriod endQoQ growth
Q22025-06-30-185.2%
Q32025-09-30-152.2%
Q42025-12-31114.8%
Q12026-03-31-414.0%

Revenue Growth Rate

Annual and quarterly growth comparison

Earnings Per Share Growth Rate

Annual and quarterly EPS growth comparison

Quarterly Performance

Name
Q1 2026YOY CHG

Revenue

$973.30M

+3.9%

Gross Profit

$108.60M

-34.9%

Gross Margin

11.16%

N/A

Market Cap

$2.73BMarket cap calculated using publicly traded shares outstanding only. Does not include unlisted, private, or dual-class non-traded shares. Implied market cap may vary.

N/A

Market Cap/Employee

$506.15K

N/A

Employees

5,400

N/A

Net Income

-$32.40M

-194.2%

EBITDA

$77.40M

-46.8%

Quarterly Fundamentals

Name
Q1 2026YOY CHG

Total Cash

$492.50M

-29.3%

Total Debt

$429.60M

+6.8%

Accounts Receivable

$309.50M

+11.5%

Inventory

$405.50M

-3.0%

Long Term Debt

$415.30M

+7.6%

Short Term Debt

$14.30M

-10.6%

Return on Assets

-2.10%

N/A

Return on Invested Capital

-1.87%

N/A

Free Cash Flow

-$92.50M

-948.6%

Operating Cash Flow

$30.00M

-75.0%

Other Investments to Explore

People Also Watch

Symbol / CompanyPricePrice Chg
GPORGulfport Energy Corp
$152.91-0.31%
ARLPAlliance Resource Partners, L.P.
$24.42-0.69%
CVICVR Energy, Inc.
$35.13+4.99%
AMRAlpha Metallurgical Resources, Inc.
$143.80-0.98%

Trending Stocks

Symbol / CompanyPricePrice Chg
ONDSOndas
$6.53-0.02%
AALAmerican Airlines Group
$14.98-0.04%
INTCIntel
$95.04-0.02%
JOBYJoby Aviation
$7.23-0.01%

Questions About BTU

What is the current price of Peabody Energy?

Peabody Energy is trading at $22.44 per share.

What is the 52-week range for Peabody Energy?

Over the past 52 weeks, Peabody Energy has traded between $14.25 and $41.14.

How much debt does Peabody Energy have?

As of the most recent reporting period, Peabody Energy reported total debt of $429.60M.

How much cash does Peabody Energy have on hand?

Peabody Energy reported $492.50M in cash and cash equivalents in its most recent financial results.

What is Peabody Energy’s dividend yield?

Peabody Energy currently has a dividend yield of 1.34%.

Premium Investing Services

Invest better with The Motley Fool. Get stock recommendations, portfolio guidance, and more from The Motley Fool's premium services.