Accessibility Menu
EMCOR Group logo

EMCOR Group

(NYSE) EME

Current Price$741.28
Market Cap$33.07BMarket cap calculated using publicly traded shares outstanding only. Does not include unlisted, private, or dual-class non-traded shares. Implied market cap may vary.
Since IPO (1995)+40,266%
5 Year+532%
1 Year+33%
1 Month-10%
EMCOR Group last closing stock price
MetricPriceDate
Last closeUSD 744.162026-07-17
EMCOR Group stock price return by period
PeriodPrice returnPrice at period startPeriod start date
1 week-4.76%USD 781.382026-07-10
1 month-10.02%USD 827.072026-06-17
3 month-7.63%USD 805.632026-04-17
Year to date+21.83%USD 610.812025-12-31
1 year+33.33%USD 558.142025-07-17
3 year+292.9%USD 189.402023-07-18
5 year+532.45%USD 117.662021-07-16
Since inception+40,266.32%USD 1.841995-07-24

EMCOR Group Financials at a Glance

Market Cap

$33.07BMarket cap calculated using publicly traded shares outstanding only. Does not include unlisted, private, or dual-class non-traded shares. Implied market cap may vary.

Revenue (TTM)

$17.75B

Net Income (TTM)

$1.33B

EPS (TTM)

$29.88

P/E Ratio

24.90

Dividend

$1.45

Beta (Volatility)

1.11 (Average)

Price

$741.28

Volume

1,526,854

Open

$728.58

Previous Close

$744.16

Daily Range

$717.28 - $744.96

52-Week Range

$540.00 - $951.96

Estimated Earnings Date

Jul 30, 2026

EME: Motley Fool Moneyball Superscore

82

Our CEO Is Handing Members His Secret Weapon

It's called Motley Fool Moneyball, our new proprietary AI tool

We spent over half a million dollars in R&D to build a tool that makes stock research faster, sharper, and smarter. Our analysts use it every day, and now, you can too.

Get Access Now

About EMCOR Group

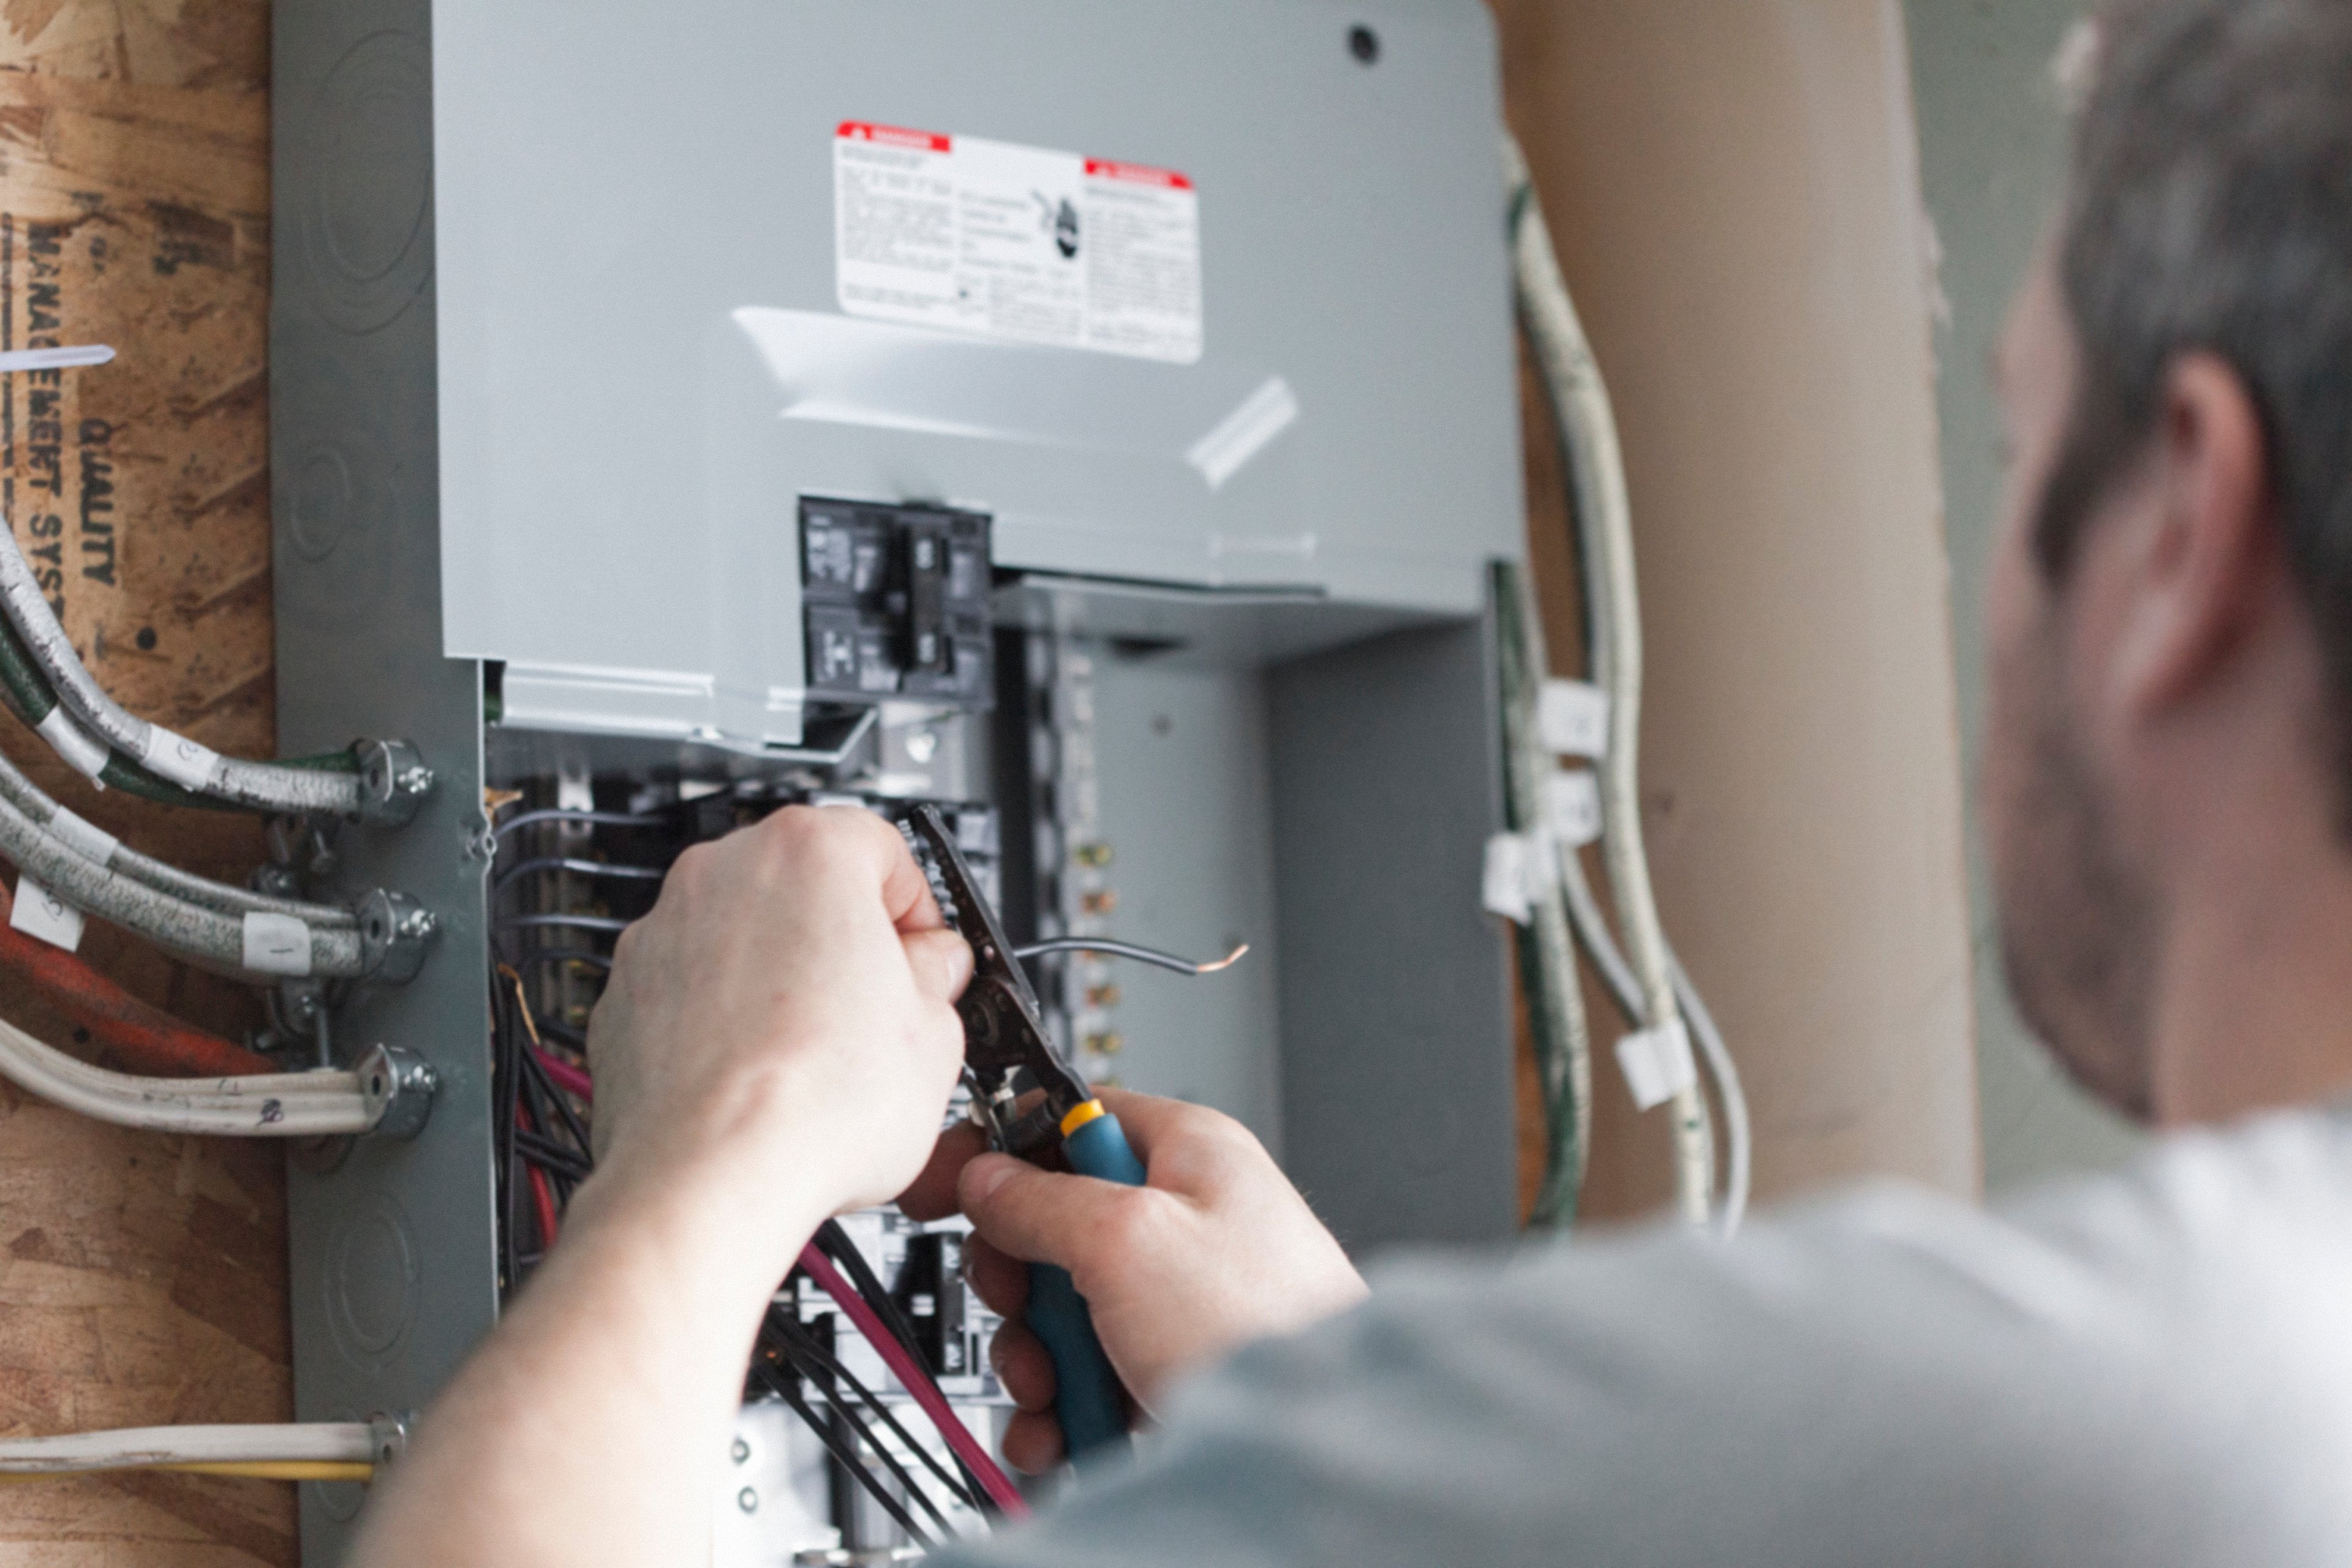
EMCOR helps keep buildings running by installing and fixing their power, water, and air systems. It works for big clients like hospitals, data centers, and government offices to manage their complex facilities. The company also repairs critical equipment for refineries and chemical plants to keep them safe and efficient.

What EMCOR Does

  • Electrical Construction: Designs and installs power systems, lighting, and data cabling for facilities like data centers; accounts for 42% of construction revenues in 2025.
  • Mechanical Construction: Builds and maintains heating, cooling, and plumbing systems for hospitals and factories; accounts for 58% of construction revenues in 2025.
  • Building Services: Provides on-site maintenance, janitorial help, and energy management for private and government buildings; represents 21% of 2025 total revenues.
  • Industrial Services: Fixes and maintains critical gear at oil and gas plants, including specialized welding and cleaning; accounts for 7% of 2025 total revenues.

A Shifting Footprint

  • Acquired Miller Electric Company to expand electrical and technology services in the United States.
  • Sold all United Kingdom operations on December 1, 2025, to focus primarily on the United States market.
  • Leveraged industrial expertise to begin constructing and maintaining carbon capture and renewable energy projects.
  • Expanded data center services to support the growth of cloud computing and artificial intelligence.

What Makes EMCOR Stand Out

The company maintains a safety record roughly 60% better than the industry average, which helps it win high-stakes projects. Its decentralized model gives local managers the power to react quickly to the specific needs of their regional customers.

Growth by the Numbers

  • Revenue reached $16.99 billion for the full year 2025.
  • Quarterly revenue hit $4.5 billion in Q4 2025, up 19.8% from Q4 2024.
  • Net income rose to $431.8 million in Q4 2025, a 47.8% increase year-over-year.
  • Free cash flow grew to $492.5 million in Q4 2025, up 9% from the previous year.
  • Operating income reached $531.6 million in Q4 2025, up 36.8% from $388.6 million in Q4 2024.

Bottom Line

EMCOR has transitioned into a United States-focused specialist serving high-growth sectors like data centers and high-tech manufacturing. Its history of steady acquisitions and focus on complex infrastructure projects has fueled significant revenue and profit growth.

AI Generated • Apr 19, 2026

Industry

Construction and Engineering

Employees

44,000

CEO

Anthony J. Guzzi, MBA

Headquarters

Norwalk, CT 06851-1092, US

EME Financials

Key Financial Metrics (TTM)

Gross Margin

19.54%

Operating Margin

9.89%

Net Income Margin

7.52%

Return on Equity

38.34%

Return on Capital

37.00%

Return on Assets

14.04%

Earnings Yield

4.02%

Dividend Yield

0.19%

Payout Ratio

3.85%

Stock Overview

Market Cap

$33.07BMarket cap calculated using publicly traded shares outstanding only. Does not include unlisted, private, or dual-class non-traded shares. Implied market cap may vary.

Shares Outstanding

44.44M

Volume

1.53M

Avg. Volume

424.96K

Financials (TTM)

Gross Profit

$3.47B

Operating Income

$1.76B

EBITDA

$2.09B

Operating Cash Flow

$1.19B

Capital Expenditure

-$115.33M

Free Cash Flow

$1.08B

Cash & ST Invst.

$916.42M

Total Debt

$516.52M

EMCOR Group Performance Analysis

EMCOR Group annual revenue and year-over-year revenue growth by fiscal year
Fiscal yearPeriod endRevenueYoY growth
20222022-12-31USD 11,076,120,00011.8%
20232023-12-31USD 12,582,873,00013.6%
20242024-12-31USD 14,566,116,00015.8%
20252025-12-31USD 16,986,422,00016.6%
EMCOR Group sequential (quarter-over-quarter) revenue growth by fiscal quarter
Fiscal quarterPeriod endQoQ growth
Q22025-06-3011.3%
Q32025-09-30-0.1%
Q42025-12-315.0%
Q12026-03-312.5%
EMCOR Group annual diluted earnings per share and year-over-year EPS growth by fiscal year
Fiscal yearPeriod endDiluted EPSYoY growth
20222022-12-31USD 8.1014.8%
20232023-12-31USD 13.3164.3%
20242024-12-31USD 21.5261.7%
20252025-12-31USD 28.1931.0%
EMCOR Group sequential (quarter-over-quarter) diluted earnings per share growth by fiscal quarter
Fiscal quarterPeriod endQoQ growth
Q22025-06-3027.8%
Q32025-09-30-2.2%
Q42025-12-3146.7%
Q12026-03-31-29.0%

Revenue Growth Rate

Annual and quarterly growth comparison

Earnings Per Share Growth Rate

Annual and quarterly EPS growth comparison

Quarterly Performance

Name
Q1 2026YOY CHG

Revenue

$4.63B

+19.7%

Gross Profit

$863.95M

+19.5%

Gross Margin

18.67%

N/A

Market Cap

$33.07BMarket cap calculated using publicly traded shares outstanding only. Does not include unlisted, private, or dual-class non-traded shares. Implied market cap may vary.

N/A

Market Cap/Employee

$751.61K

N/A

Employees

44,000

N/A

Net Income

$305.48M

+26.9%

EBITDA

$462.65M

+26.4%

Quarterly Fundamentals

Name
Q1 2026YOY CHG

Total Cash

$916.42M

+58.9%

Total Debt

$516.52M

-18.7%

Accounts Receivable

$4.94B

+19.5%

Inventory

$130.21M

+38.3%

Long Term Debt

$411.82M

-24.8%

Short Term Debt

$104.70M

+19.4%

Return on Assets

14.04%

N/A

Return on Invested Capital

37.48%

N/A

Free Cash Flow

-$28.15M

-134.2%

Operating Cash Flow

$558.00K

-99.5%

Other Investments to Explore

People Also Watch

Symbol / CompanyPricePrice Chg
IRIngersoll Rand Inc.
$82.24-3.00%
UALUnited Airlines Holdings, Inc.
$115.41-2.86%
RKLBRocket Lab USA, Inc.
$67.62+0.40%
VRSKVerisk Analytics, Inc.
$200.68-0.40%

Trending Stocks

Symbol / CompanyPricePrice Chg
ONDSOndas
$6.53-0.02%
NOKNokia
$10.12-0.03%
PATHUiPath
$12.15+0.01%
JOBYJoby Aviation
$7.23-0.01%

Questions About EME

What is the current price of EMCOR Group?

EMCOR Group is trading at $744.16 per share.

What is the 52-week range for EMCOR Group?

Over the past 52 weeks, EMCOR Group has traded between $540.00 and $951.96.

How much debt does EMCOR Group have?

As of the most recent reporting period, EMCOR Group reported total debt of $516.52M.

How much cash does EMCOR Group have on hand?

EMCOR Group reported $916.42M in cash and cash equivalents in its most recent financial results.

What is EMCOR Group’s dividend yield?

EMCOR Group currently has a dividend yield of 0.19%.

Premium Investing Services

Invest better with The Motley Fool. Get stock recommendations, portfolio guidance, and more from The Motley Fool's premium services.