Accessibility Menu
Yum China logo

Yum China(NYSE) YUMC

Market Cap$16.96BMarket cap calculated using publicly traded shares outstanding only. Does not include unlisted, private, or dual-class non-traded shares. Implied market cap may vary.
Since IPO (2016)+115%
5 Year-10%
1 Year+12%
1 Month+14%
Premium Feature
Moneyball Superscore
77/100
$49.45
+1.17%
+0.57Today
After hours$49.51+$0.06 (+0.12%)
Yum China last closing stock price
MetricPriceDate
Last closeUSD 49.522026-08-21
Yum China stock price return by period
PeriodPrice returnPrice at period startPeriod start date
1 week+4.06%USD 47.592026-08-14
1 month+14.05%USD 43.422026-07-22
3 month+11.86%USD 44.272026-05-22
Year to date+4.99%USD 47.162025-12-31
1 year+12.32%USD 44.092025-08-21
3 year-0.35%USD 49.692023-08-22
5 year-9.95%USD 54.992021-08-20
Since inception+114.84%USD 23.052016-10-17

Yum China Financials at a Glance

Market Cap

$16.96BMarket cap calculated using publicly traded shares outstanding only. Does not include unlisted, private, or dual-class non-traded shares. Implied market cap may vary.

Revenue (TTM)

$12.44B

Net Income (TTM)

$975.00M

EPS (TTM)

$2.72

P/E Ratio

18.18

Dividend

$1.06

Beta (Volatility)

0.72 (Low)

Price

$49.45

Volume

972,015

Open

$48.99

Previous Close

$49.52

Daily Range

$48.89 - $49.73

52-Week Range

$40.15 - $58.39

Estimated Earnings Date

Nov 3, 2026

YUMC: Motley Fool Moneyball Superscore

77

Our CEO Is Handing Members His Secret Weapon

It's called Motley Fool Moneyball, our new proprietary AI tool

We spent over half a million dollars in R&D to build a tool that makes stock research faster, sharper, and smarter. Our analysts use it every day, and now, you can too.

Get Access Now

About Yum China

Yum China Holdings, Inc. runs thousands of restaurants across China. It serves chicken, pizza, and coffee to millions of diners daily. The company manages global brands and local food favorites.

Feeding Millions Across China

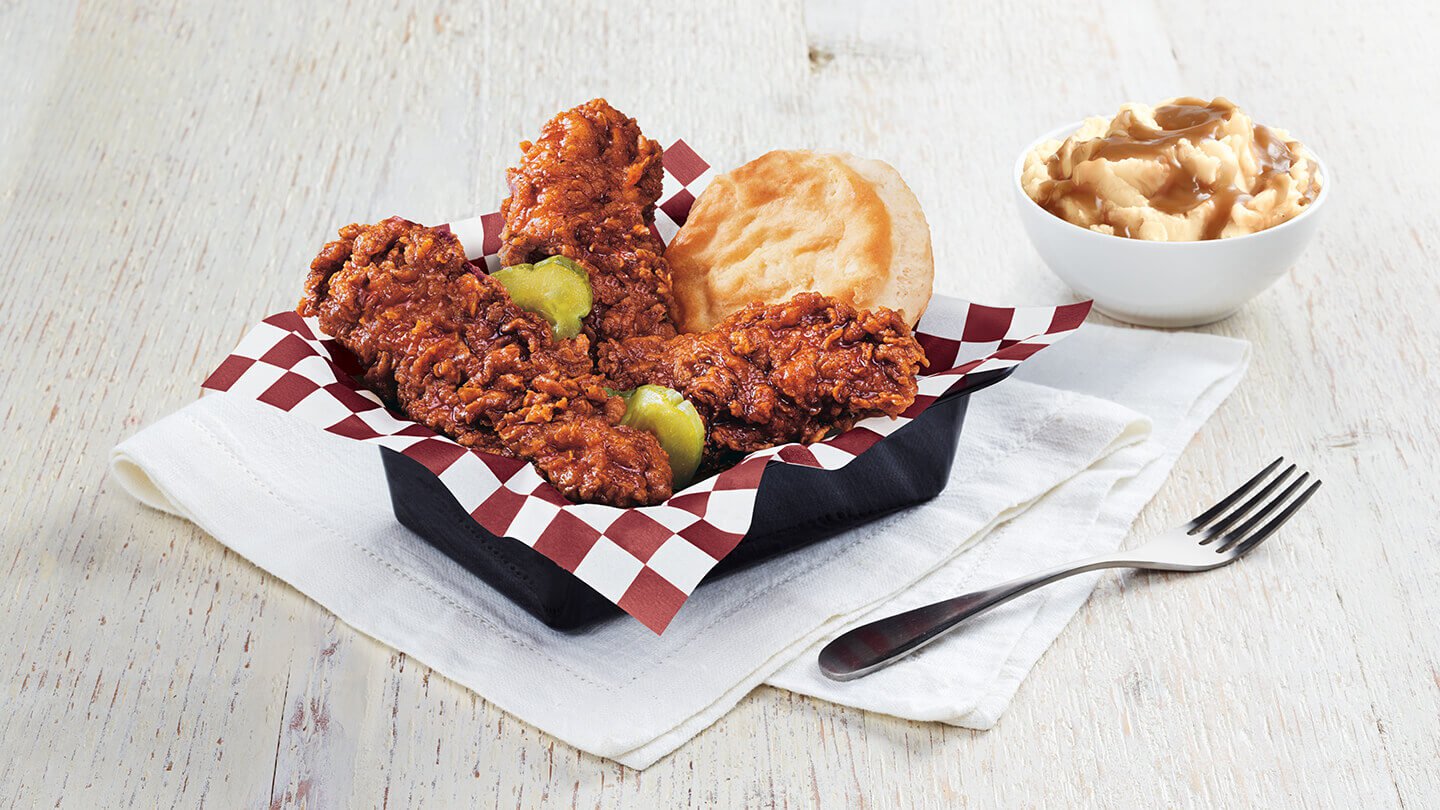
  • KFC: Quick-service brand focusing on chicken meals; generated $2.34 billion in total revenue during the second quarter of 2026.
  • Pizza Hut: Casual dining brand offering pizza and Western cuisine; generated $613 million in total revenue during the second quarter of 2026.
  • Emerging Brands: Portfolio including Lavazza, Little Sheep, and Taco Bell; generated $274 million in total revenue during the second quarter of 2026.
  • V-Gold Mall: Mobile e-commerce platform selling electronics and prepared meals; operates alongside the core dining business.

Recent Growth and Strategic Moves

  • Acquired ownership of the Pizza Hut brand in Mainland China for $1.2 billion in August 2026.
  • Expanded the total restaurant count to 19,297 locations by June 30, 2026, a 14% increase year over year.
  • Returned $1.5 billion to shareholders through dividends and share repurchases during 2025.
  • Established a joint venture with Lavazza Group to develop Italian coffee concepts throughout China.

Why the Company Stands Out

Yum China operates the largest restaurant network in China and manages its own delivery team. The business uses a central procurement model and invests in automation to maintain its supply chain.

Key Financial Facts

  • Total revenues were $3.14 billion in the second quarter of 2026, up 13% year over year.
  • Operating profit reached $348 million in the second quarter of 2026, up 14% year over year.
  • Net income was $244 million in the second quarter of 2026, up 14% year over year.
  • The restaurant network grew to 19,297 units as of June 30, 2026, up 14% year over year.
  • Diluted earnings per common share were $0.70 in the second quarter of 2026, up 21% year over year.

Evolution of a Dining Leader

Yum China has evolved from a Western fast-food operator into a diversified dining and e-commerce platform. Its large-scale infrastructure and digital capabilities support its position as the largest restaurant company in China.

AI Generated • Aug 10, 2026

Industry

Hotels, Restaurants and Leisure

Employees

290,000

CEO

Joey Wat, MBA

Headquarters

Shanghai, SH 200030, CN

YUMC Financials

Key Financial Metrics (TTM)

Gross Margin

17.23%

Operating Margin

12.19%

Net Income Margin

7.84%

Return on Equity

17.84%

Return on Capital

18.88%

Return on Assets

8.97%

Earnings Yield

5.50%

Dividend Yield

2.14%

Payout Ratio

38.74%

Stock Overview

Market Cap

$16.96BMarket cap calculated using publicly traded shares outstanding only. Does not include unlisted, private, or dual-class non-traded shares. Implied market cap may vary.

Shares Outstanding

342.46M

Volume

972.01K

Avg. Volume

1.67M

Financials (TTM)

Gross Profit

$2.14B

Operating Income

$1.52B

EBITDA

$1.93B

Operating Cash Flow

$1.59B

Capital Expenditure

-$640.25M

Free Cash Flow

$945.86M

Cash & ST Invst.

$1.39B

Total Debt

$2.30B

Yum China Performance Analysis

Yum China annual revenue and year-over-year revenue growth by fiscal year
Fiscal yearPeriod endRevenueYoY growth
20222022-12-31USD 9,569,000,000-2.9%
20232023-12-31USD 10,978,000,00014.7%
20242024-12-31USD 11,303,000,0003.0%
20252025-12-31USD 11,797,000,0004.4%
Yum China sequential (quarter-over-quarter) revenue growth by fiscal quarter
Fiscal quarterPeriod endQoQ growth
Q32025-09-3015.0%
Q42025-12-31-11.9%
Q12026-03-3115.9%
Q22026-06-30-4.1%
Yum China annual diluted earnings per share and year-over-year EPS growth by fiscal year
Fiscal yearPeriod endDiluted EPSYoY growth
20222022-12-31USD 1.04-54.4%
20232023-12-31USD 1.9789.3%
20242024-12-31USD 2.3418.6%
20252025-12-31USD 2.507.2%
Yum China sequential (quarter-over-quarter) diluted earnings per share growth by fiscal quarter
Fiscal quarterPeriod endQoQ growth
Q32025-09-3033.3%
Q42025-12-31-48.7%
Q12026-03-31123.1%
Q22026-06-30-19.5%

Revenue Growth Rate

Annual and quarterly growth comparison

Earnings Per Share Growth Rate

Annual and quarterly EPS growth comparison

Quarterly Performance

Name
Q2 2026YOY CHG

Revenue

$3.14B

+12.6%

Gross Profit

$537.00M

+12.8%

Gross Margin

17.11%

N/A

Market Cap

$16.96BMarket cap calculated using publicly traded shares outstanding only. Does not include unlisted, private, or dual-class non-traded shares. Implied market cap may vary.

N/A

Market Cap/Employee

$130.45K

N/A

Employees

130,000

N/A

Net Income

$244.00M

+13.5%

EBITDA

$518.00M

+21.9%

Quarterly Fundamentals

Name
Q2 2026YOY CHG

Total Cash

$1.39B

-35.7%

Total Debt

$2.30B

+3.0%

Accounts Receivable

$354.00M

+0.3%

Inventory

$459.00M

+27.5%

Long Term Debt

$1.80B

-0.6%

Short Term Debt

$499.00M

+18.2%

Return on Assets

8.97%

N/A

Return on Invested Capital

17.97%

N/A

Free Cash Flow

$304.86M

+5.1%

Operating Cash Flow

$434.11M

+5.4%

Other Investments to Explore

People Also Watch

Symbol / CompanyPricePrice Chg
BBYBest Buy Co., Inc.
$85.89+0.19%
DKSDICK'S Sporting Goods, Inc.
$183.23+2.17%
GPCGenuine Parts Company
$133.96+0.78%
TXRHTexas Roadhouse, Inc.
$204.48+1.64%

Trending Stocks

Symbol / CompanyPricePrice Chg
TSLLDirexion Shares ETF Trust - Direxion Daily Tsla Bull 2x ETF
$9.77+0.10%
IBITiShares Bitcoin Trust
$43.68+0.06%
BITOProShares Trust - ProShares Bitcoin ETF
$10.41+0.06%
MARAMara Holdings
$11.26+0.01%

Questions About YUMC

What is the current price of Yum China?

Yum China is trading at $49.52 per share.

What is the 52-week range for Yum China?

Over the past 52 weeks, Yum China has traded between $40.15 and $58.39.

How much debt does Yum China have?

As of the most recent reporting period, Yum China reported total debt of $2.30B.

How much cash does Yum China have on hand?

Yum China reported $485.00M in cash and cash equivalents in its most recent financial results.

What is Yum China’s dividend yield?

Yum China currently has a dividend yield of 2.14%.

Premium Investing Services

Invest better with The Motley Fool. Get stock recommendations, portfolio guidance, and more from The Motley Fool's premium services.