The S&P 500 has historically averaged about 10% per year over a multi-decade period, including dividends. However, there’s a lot more to the story. In this article, we’ll explore the average returns of the S&P 500, why the average can vary depending on the source you use, and what it means to you as an investor.
The S&P 500 has compounded at 9.98% a year since 1928
Over the long run, the average return of the S&P 500 has been 9.98% per year -- just under 10%. Specifically, this is the average return since 1928, a period that covers nearly a full century. However, there are a few things to clarify:
- The 9.98% return is the CAGR (compound annual growth rate). This means that it is the long-term growth rate of an investment in the S&P 500 since 1928.
- On the other hand, the arithmetic mean is 11.7% for the same period -- meaning that in the average individual year, this is the index’s total return. Mathematically, if you add the total returns for each year together and divide by the number of years, you will get the arithmetic mean.
- These figures refer to total returns, which include stock price appreciation plus dividends. For example, if a stock gains 6% in a year and also pays a 3% dividend yield, its total return would be 9%.
Three reasons the “average stock market return” varies by source
If you search for the average returns of the S&P 500, you’re likely to see several different figures. And there are a few reasons why that is (and why the other sources aren’t necessarily wrong).
Long-run average vs. recent 10- and 20-year averages
First, the time period considered makes a big difference. As stated in the previous section, the S&P 500’s annualized return since 1928 has been 9.98%. As another example, from 1964 through 2025, the index produced a CAGR of 10.5%. Other multi-decade timeframes can vary slightly from these figures as well.
Nominal vs. inflation-adjusted
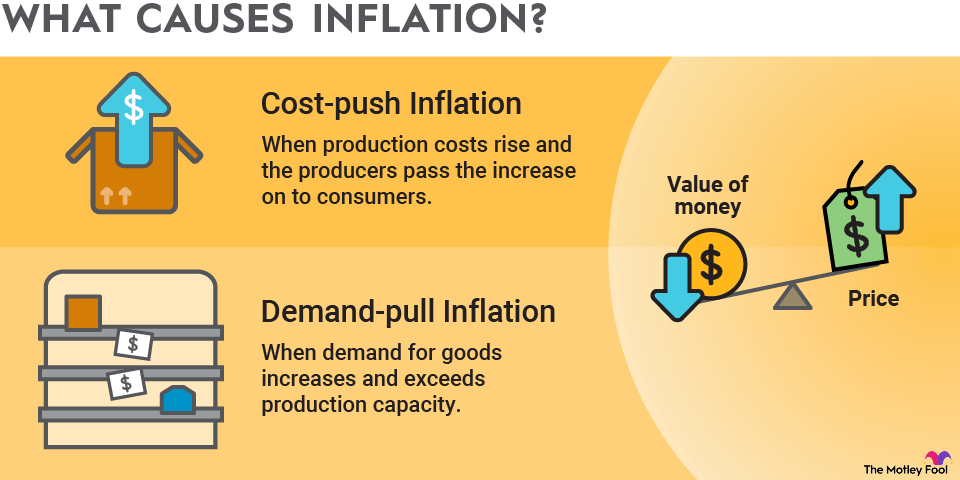
All the figures discussed so far have been nominal returns, which simply tell us the returns in dollar terms. However, when adjusting for the effects of inflation, the effective return of the S&P 500 would be about three percentage points lower.
Price return versus total return
Most sources consider long-term stock market returns in terms of total return -- that is, with dividends included. On the other hand, if you simply consider stock price appreciation or price return, the long-term average would be significantly lower.