The iShares Core S&P 500 ETF (IVV 1.28%) and the Vanguard S&P 500 ETF (VOO 1.23%) are nearly indistinguishable in terms of cost, performance, and portfolio composition. VOO, however, stands out for its sheer scale, with significantly greater assets under management.
Both IVV and VOO replicate the S&P 500 (^GSPC 1.25%)index, aiming to capture the performance of the 500 largest publicly traded companies in the U.S. Below, we compare the two exchange-traded funds (ETFs) in terms of cost, returns, risk, and portfolio makeup to help investors identify where meaningful differences emerge and make informed investing decisions.
Snapshot (cost & size)
| Metric | IVV | VOO |
|---|---|---|
| Issuer | iShares | Vanguard |
| Expense ratio | 0.03% | 0.03% |
| 1-yr total return (as of Dec. 19, 2025) | 16.5% | 18% |
| Dividend yield | 1.04% | 1.1% |
| Beta | 1.00 | 1.00 |
| AUM | $680.6 billion | $1.5 trillion |
Beta measures price volatility relative to the S&P 500; beta is calculated from five-year weekly returns. The 1-yr return represents total return over the trailing 12 months.
There is no cost advantage between the two: both IVV and VOO charge a low 0.03% annual expense and deliver an identical dividend yield of around 1%, so investors may base their decision on other factors.
Performance & risk comparison
| Metric | IVV | VOO |
|---|---|---|
| Max drawdown (5 y) | -24.53% | -24.52% |
| Growth of $1,000 over 5 years | $1,845 | $1,842 |
Data as of Dec. 19, 2025.
What's inside
The Vanguard S&P 500 ETF holds 505 stocks and is designed to mirror the S&P 500 index, with a current sector mix led by technology at 34.6%, followed by financials, comsumer discretionary, and communication services. As of the last reported date of Nov. 30, VOO's largest positions are Nvidia (NVDA 1.36%) at 7.38%, Apple (AAPL 1.86%) at 7.07%, and Microsoft (MSFT 0.29%) at 6.25%. The fund has a lengthy track record, spanning 15.3 years, and no notable quirks or restrictions that differentiate it from the underlying index.
The iShares Core S&P 500 ETF is structured nearly identically, with 503 holdings and a similar sector tilt -- technology at 34.02%, financials at 13.52%, and consumer discretionary at 10.6%. Its top holdings are Nvidia, Apple, and Microsoft, each representing a similar share of assets as in VOO. Both funds are conventional S&P 500 index trackers with no unique overlays or unusual features.
For more guidance on ETF investing, check out the full guide at this link.
What this means for investors
Since the S&P 500 index is used as a benchmark for the overall stock market, investing in an S&P 500 ETF that tracks the performance of the index at minimal costs is the best and easiest way to invest in the stock market, whether you are a beginner or a seasoned investor. By buying shares of an S&P 500 ETF, you can indirectly but instantly buy shares of all 500 S&P 500 constituents without having to pick individual stocks.
Needless to say, it's a surefire way to participate in the overall stock market's performance to build wealth. With the S&P 500 index surging to record highs in December 2025, S&P 500 ETFs are also hitting record highs. That includes two of the largest ETFs -- the Vanguard S&P 500 ETF and the iShares Core S&P 500 ETF.
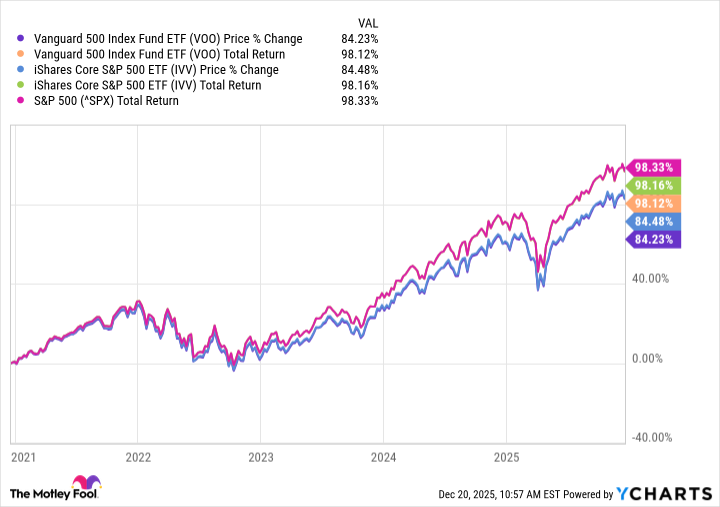
An interesting aspect of investing in these S&P 500 ETFs is that you also get to enjoy the dividends that the S&P 500 companies pay. The ETFs collect dividends and pass them on to their shareholders. You could also opt for a dividend reinvestment plan through your broker, which means the dividends are automatically reinvested to buy more shares in your account. Reinvesting dividends can make a considerable difference to your total returns, as reflected in the graph above.
When it comes to choosing between the two ETFs, a retail investor can opt for either VOO or IVV as they are similar in nearly every aspect. VOO's size and higher trading volumes, however, may be more suitable for high-volume traders and investors becasue of better liquidity.
Glossary
ETF: Exchange-traded fund; a pooled investment fund traded on stock exchanges, holding a basket of assets.
S&P 500: A stock market index tracking 500 of the largest publicly traded U.S. companies.
Expense ratio: The annual fee, as a percentage of assets, that a fund charges its investors.
Dividend yield: Annual dividends paid by a fund, expressed as a percentage of its share price.
Assets under management (AUM): The total market value of assets a fund manages on behalf of investors.
Beta: A measure of an investment's volatility relative to the overall market or a benchmark index.
Max drawdown: The largest percentage drop from a fund's peak value to its lowest point over a specific period.
Total return: The investment's price change plus all dividends and distributions, assuming those payouts are reinvested.
Sector tilt: The proportion of a fund's holdings allocated to specific industry sectors, compared to a benchmark.
Index tracker: A fund designed to replicate the performance of a specific market index.
Liquidity: How easily an asset or security can be bought or sold without affecting its price.