Image source: The Motley Fool.
DATE
Thursday, July 30, 2026 at 8:00 a.m. ET
CALL PARTICIPANTS
- Head of Investor Relations - Charles Christman
- Chief Executive Officer - Antonio Filosa
- Chief Financial Officer - Joao Laranjo
TAKEAWAYS
- Net Revenues -- EUR 43.5 billion, representing a 13% increase driven by higher volume in North America and Europe.
- Adjusted Operating Income (AOI) -- EUR 773 million, an improvement of EUR 560 million compared to the prior year.
- AOI Margin -- 1.8%, reflecting a 120 basis point improvement year over year.
- Consolidated Shipments -- 1.6 million units, growing 10% year over year with North American shipments rising by 122,000 units.
- Industrial Free Cash Flow -- Positive EUR 1 billion, an improvement of EUR 1 billion from the prior year due to higher AOI and positive seasonal working capital.
- North America AOI -- EUR 284 million with a 1.6% margin, a year-over-year improvement of EUR 724 million.
- Industrial Cost Savings -- EUR 1.9 billion, driven by manufacturing efficiencies, purchasing savings, and the non-repeat of prior year warranty costs.
- U.S. Market Share -- 40 basis point increase in North America, including a 50 basis point gain specifically in the U.S. market.
- Inventory Levels -- 1.4 million units, a 20% year-over-year increase reflecting new vehicle launches and a temporary buildup ahead of summer shutdowns.
- Value Creation Program (VCP) -- Target of EUR 6 billion in annual run rate cost reductions by 2028, with 40% of initiatives expected to be implemented by the end of 2026.
- Europe BEV Sales -- 20% year-over-year increase, rising to 61% growth when including Leapmotor sales.
- Leapmotor Performance -- Q2 2026 sales increased sixfold year over year, making it the fifth largest Chinese automotive brand in Europe.
- Operational Efficiency -- Production efficiency improved 870 basis points in North America and 170 basis points in Europe.
- Product Quality -- Three-month in-service quality improved 38% in North America and 24% in Europe.
- Pro 1 Division -- Maintained the top position in light commercial vehicles in the Euro 30 region with over 28% market share.
- Tariff Guidance -- Expected net tariff expenses of EUR 1 billion to EUR 1.2 billion for the full year 2026.
- CapEx and R&D -- Spending expected to range between 6.5% to 7% of net revenues for the full year.
- H2 2025 Charges -- Guidance reflects approximately EUR 2 billion in payments, with EUR 900 million already paid in the first half of 2026.
- Ram Brand Sales -- Ram sales increased 12% year over year in North America and 10% in Brazil.
- Chrysler Sales -- 54% year-over-year growth following the launch of the new Pacifica.
- Foreign Exchange Impact -- Negative impact of EUR 861 million, primarily attributed to the devaluation of the Turkish lira.
Need a quote from a Motley Fool analyst? Email [email protected]
RISKS
- Laranjo stated, "The region continues to experience pricing pressure, which partially offset the positive impacts of improved manufacturing efficiency," regarding operations in Europe.
- Filosa stated, "Our execution on quality in the past was not what it needed to be," acknowledging historical challenges in manufacturing standards.
- Laranjo noted, "we expect that raw material continues to be a headwind and growing in the second half versus what we saw in the first half," regarding input cost projections.
SUMMARY
Management for Stellantis N.V. (STLA -2.31%) reaffirmed its full year 2026 financial guidance and confirmed expectations for positive industrial free cash flow in 2027. The company reported that Q2 performance was driven by a 10% increase in shipments and a 13% rise in net revenues, supported by a significant product offensive and improved industrial execution. The company stated that its Value Creation Program remains on track to deliver substantial cost savings through 2028, while quality metrics showed double-digit improvements in both North American and European markets. Strategic focus continues to shift toward maximizing market coverage and integrating the Leapmotor brand to capture growth in the electric vehicle segment.
- CEO Filosa reported that the relaunched SRT performance division delivers margins from "2x to 3x higher than comparable non-SRT variants" across the company's vehicle lineup.
- Leapmotor localized its vehicle assembly for the C10 model in Malaysia, with the B10 launch scheduled for the third quarter of 2026.
- Management confirmed that the legendary HEMI V8 engine reintroduction served as a key driver for volume growth and profitability for the Ram 1500 during the quarter.
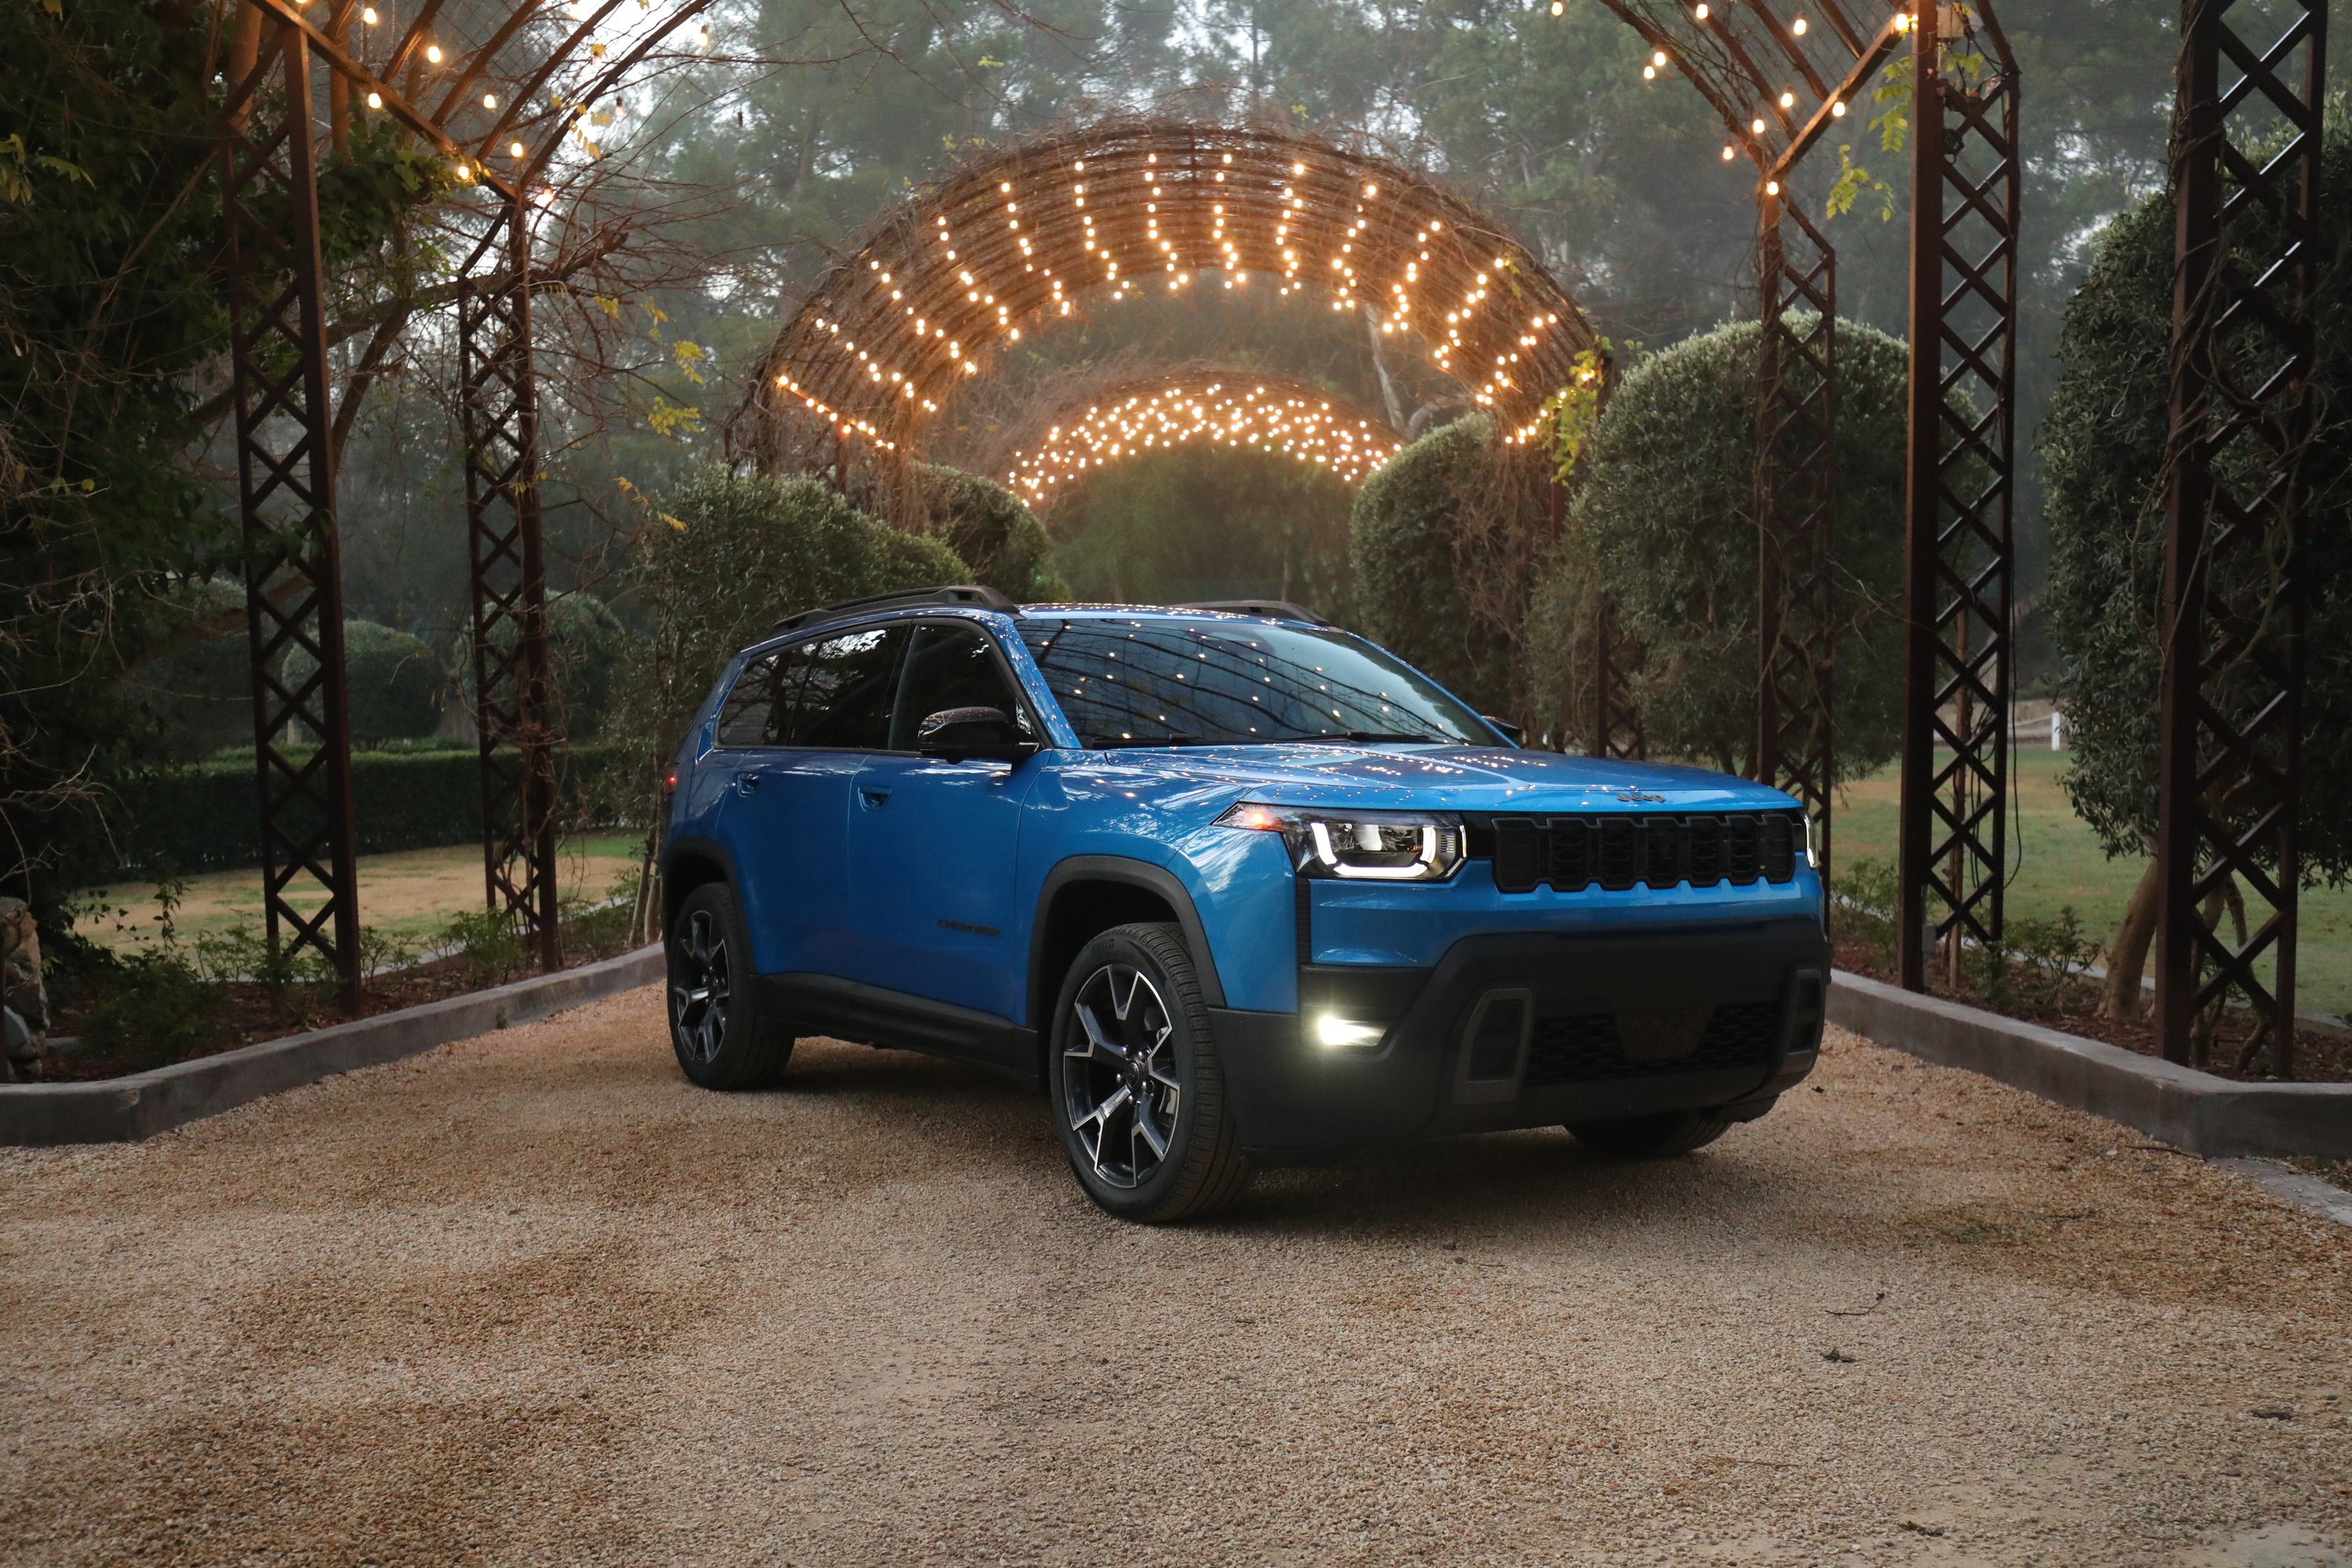
- The company plans to repatriate Jeep Cherokee production to Belvidere to eliminate current tariff exposures and improve the model's competitive pricing.
- CFO Laranjo indicated that SG&A costs increased by EUR 317 million to support marketing expenses for new vehicle launches.
- Stellantis expects Q4 2026 performance to be stronger than Q3, which will be affected by planned summer production shutdowns and raw material inflation.
- The company announced a new partnership with Dongfeng to develop and manufacture Peugeot and Jeep models specifically for the Chinese market.
INDUSTRY GLOSSARY
- AOI: Adjusted Operating Income, a non-GAAP measure used by the company to assess the performance of its operating segments.
- VCP: Value Creation Program, a strategic initiative focused on achieving industrial and material cost efficiencies.
- Smart Car Platform: A modular vehicle architecture designed by Stellantis to produce affordable mass-market vehicles across multiple brands.
- Leapmotor: A Chinese electric vehicle manufacturer partnered with Stellantis for international distribution and production.
- Pro 1: The dedicated business division within Stellantis that manages light commercial vehicle sales and strategy.
- Euro 30: A market classification representing 30 European countries used for tracking regional market share.
- HEMI: A series of internal combustion engines utilizing hemispherical combustion chambers, historically used in high-performance American vehicles.
Full Conference Call Transcript
Operator: Hello, and welcome to the Stellantis Q2 2026 Financial Results Call. [Operator Instructions] I now give the floor to Mr. Charlie Christman, Head of Investor Relations, to begin today's conference. Sir, the floor is yours.
Charles Christman: Thank you. Hello, everyone, and thank you for joining us today as we review the Stellantis Q2 2026 results. Earlier today, the presentation material for this call, along with the related press release were posted under the Investors section of the Stellantis Group website. Today, our call is hosted by Antonio Filosa, Chief Executive Officer; and Joao Laranjo, Chief Financial Officer. After their prepared remarks, Antonio and Joao will be available to answer questions from the analysts. Before we begin, I want to point out that any forward-looking statements we might make during today's call are subject to the risks and uncertainties mentioned in the safe harbor statement included on Page 2 of today's presentation.
As customary, the call will be governed by that language. Now I will hand the call over to Antonio Filosa, Chief Executive Officer of Stellantis.
Antonio Filosa: Thank you, Charlie, and thank you all very much for joining us today as we discuss our quarter 2 results. Our second quarter execution and financial performance reflect the meaningful progress that the team and I have been focused on delivering over the last 12 months. All key financial metrics are significantly improved year-over-year. Net revenues are up 13%. AOI margin is up 120 basis points. Industrial free cash flow is positive EUR 1 billion, up EUR 1 billion compared to last year. This year-over-year improvement gives us confidence in our full year '26 financial guidance, which we are reaffirming again today, including our expectation that we will have positive industrial free cash flow in 2027.
We set out our FaSTLAne 2030 strategy and its financial targets at our May 21 Investor Day, and these quarter 2 results demonstrate that we are very much on track in our journey towards those targets. In quarter 2, we made strong and significant progress on industrial execution. Through the good work of our operating teams, we have stabilized production and are running our plants much more efficiently. Year-over-year, overall production efficiency was improved 870 basis points in North America and 170 basis points in Europe. We also kept improving quality with 3 months in service quality improving 38% in North America and 24% in Europe.
And we are making encouraging daily progress in the implementation of our value creation program, VCP. And as we shared with you at Investor Day, partnerships are a key pillar of our FaSTLAne 2030 plan. The announcements we made give you a strong sense on how attractive Stellantis is as a strategic partner both to other OEMs and to leading names in the tech space. We are also making good progress with the execution of our large-scale new product plan. One of the key strategies in our FaSTLAne 2030 plan is to invest in our brands, invest in our products and expand market coverage.
In line with this plan, we are excited to have introduced the all-new Ram 1500 TRX SRT, the DS #7 and the Fiat Grande Panda ICE in H1, alongside 6 refreshed vehicles, including Opel Astra, Chrysler Pacifica and Peugeot 408, which is gaining strong momentum in Turkey. The Ram Dakota introduced in Brazil in early '26 is also delivering strong sales performance in the region's largest profit pool. We look forward to the 9 remaining new and refreshed vehicles still to come this year, and we are laser-focused on executing every one of these launches on time with the right cost and with the right quality. Now let me touch on some Q2 highlights from a regional perspective.
In North America, we keep making significant progress and improving performance, powered by our great brands, our great products and our great people. Sales in quarter 2 were up 6% year-over-year for a fourth consecutive quarter of year-over-year gains. Ram was up 12% year-over-year. Chrysler was up 54% with the launch of the new Pacifica and Jeep Grand Wagoneer also posted significant gains. Overall, market share was up 40 basis points in North America, including 50 basis points in the U.S. Canada market share was also slightly up and Mexico with its strongest second quarter on record. Let me share a few highlights on Ram.
The Ram 1500 was a key driver of both volume growth and profitability in the quarter with strong demand for the reintroduction of the legendary HEMI V8 engine. Building on that momentum, we are now shipping the highly profitable Ram 1500 TRX SRT to customers, just 6 months after its unveiling. This is the first off-road product from our SRT Performance division, which we relaunched only 1 year ago. This product follows the Dodge Durango SRT launched in December '25. And the SRT muscle truck, the Ram Rumble Bee arrives later this year, right on plan.
As we presented during Investor Day, SRT brings unique capabilities and a powerful halo effect across all our lineup while delivering margins from 2x to 3x higher than comparable non-SRT variants. Still on the product side, we have the upcoming Jeep Recon BEV and the Jeep Grand Wagoneer REV launch coming this year. Now a few words also on our U.S. dealer inventory. The increase seen in June was the result of a proactive decision to support new product launches and powertrain offerings such as the Ram HEMIs, for instance, ahead of the sale that we expect to achieve in the coming months. It was also driven by a temporary buildup in advance of our planned summer production shutdowns.
Based on preliminary sales rates in July, we expect that in July, you will see inventory already reduced from June levels. Turning to Europe. Growth in Europe was driven by strong demand for smart car platform nameplates such as Citroen C3 and C3 Aircross, Opel Frontera, Fiat Grande Panda, resulting in a 3% year-over-year increase in Stellantis brand sales in quarter 2. Including Leapmotor, sales were up 7% year-over-year, supported by the success of the T03 and the B10. This growth also reflects the acceleration we are seeing in the European passenger car BEV markets, where Stellantis BEV sales increased by 20% year-over-year and by 61% year-over-year when including Leapmotor.
In light commercial vehicles, our Pro 1 division maintained the #1 position in the Euro 30 with over 28% market share. The ongoing product offensive in Europe will further strengthen our growth drivers. First, through the expansion of the smart car portfolio with the upcoming Fiat Grizzly and Fiat Fastback. We will also have a broader coverage of the C-SUV segment with the new Jeep Compass 4xe as well as the recently launched DS #7 and the upcoming Lancia Gamma. Finally, Leapmotor represents another important growth lever and keeps gaining commercial momentum. Quarter 2 '26 sales increased sixfold year-over-year, making Leapmotor the fifth largest Chinese automotive brand in the region. Turning to South America.
We maintained our clear overall leadership position in the region. We are #1 in the region's 2 major markets with over 26% market share in both Brazil and Argentina. We also further strengthened our leadership in pickup truck in Brazil, home of the region's largest profit pool, with Ram sales increasing by 10% year-over-year. Moving now to Middle East and Africa. We delivered resilient results in a declining market with market share increasing 20 basis points despite an 8% decline in total industry volumes. The region achieved the #1 position in light commercial vehicles and maintained its #2 position overall. Lastly, in APAC.
June deliveries reached a 6-month high, and we have localized Leapmotor branded vehicle assembly in Malaysia for C10 with the B10 launch on track for the third quarter. We also announced the partnership with Dongfeng to develop and manufacture Peugeot and Jeep models in China. So in summary, we are continuing the positive trend of quarter 1 with significant year-over-year improvements in all financial metrics. And our strong disciplined execution keeps driving significant improvements both in quality and industrial efficiency. Let me now hand you to Joao to walk you through the numbers. Joao?
Joao Laranjo: Thank you, Antonio. Good afternoon and good morning, everyone. Q2 was another quarter of year-over-year improvement, in line with our full year guidance for 2026. Let me start with the key financial figures. Consolidated shipments were 1.6 million units, up 10% year-over-year, with growth driven by North America and Europe. Net revenues were EUR 43.5 billion, up more than EUR 5 billion or 13% compared to Q2 of last year. This improvement was driven mainly by the higher volume in North America, which was up 122,000 units year-over-year. Adjusted operating income was EUR 773 million in Q2, improving by EUR 560 million compared to Q2 of last year. AOI margin was 1.8%, representing a 120 basis point improvement year-over-year.
The key drivers of the year-over-year AOI improvement were: Volume/mix had a positive impact of EUR 376 million, reflecting higher shipments in North America and Europe. Mix was unfavorable, mainly due to LEV penetration in Europe, partially offsetting the volume improvement. Net pricing was negative EUR 456 million, mostly driven by pricing pressure in Europe. Industrial costs improved by more than EUR 1.9 billion. This was driven by 3 main factors. First, we continue to improve our operational execution. Manufacturing efficiencies and purchasing savings, including those related to VCP more than offset increased raw material and tariff headwinds. Second, we had a non-repeat of prior year warranty costs from recall campaigns in Europe.
Finally, the reduction of regulatory expenses in North America. SG&A costs increased by EUR 317 million, largely reflecting higher marketing expenses to support volume growth. Lastly, foreign exchange and other had a negative impact of EUR 861 million, driven mainly by the Turkish lira devaluation, the non-repeat of an indirect tax credit in Brazil and the impact of lower residual value in the used vehicle business. Moving to industrial free cash flow. Industrial free cash flow was positive EUR 1 billion in Q2, an improvement of EUR 1 billion year-over-year. The improvement was driven by 3 factors: first, higher AOI; second, positive seasonal working capital dynamics associated with higher Q2 volumes.
Third, a lower run rate of CapEx and R&D spending during the quarter. The time of these investments remains fully aligned with our FaSTLAne product plan and is reflected in our full year's guidance. We continue to expect full year CapEx and R&D spending to be 6.5% to 7% of net revenues. These benefits were partially offset by provisions, including approximately EUR 300 million of cash outflows related to H2 2025 charts. Now looking at inventory. Total inventory increased 20% year-over-year to 1.4 million units. The increase primarily reflects the launch of new and refreshed vehicles and powertrain offerings and is consistent with our expectations for sales growth.
As Antonio noted, dealer inventory also includes a temporary buildup ahead of the customary summer production shutdowns. As a result, we expect July inventory levels to be meaningfully lower than those recorded in June. Turning to our regional performance. North America delivered AOI of EUR 284 million with an AOI margin of 1.6%, representing a year-over-year improvement of EUR 724 million. This is mostly driven by higher volume, including the Ram 1500, Jeep Grand Wagoneer, Gruner ICE and the Chrysler Pacifica. Shipments were up 38%, driven, as we have already noted, by the launch cadence of our new products and build ahead in advance of the pre-planned summer shutdown.
It was also driven by year-over-year improvement in industrial costs and the reduction of regulatory expenses. In Europe, AOI was negative EUR 94 million, an improvement of EUR 265 million year-over-year. The region continues to experience pricing pressure, which partially offset the positive impacts of improved manufacturing efficiency and purchasing costs and the non-repeat of EUR 474 million of recall campaign costs in 2025. In South America, we delivered AOI of EUR 402 million. Volume was down slightly year-over-year with a decline in Argentina more than offsetting gains in Brazil. The performance of the region remains resilient despite a challenging market and increasing competition.
The AOI was in line with prior year, excluding the non-repeat of EUR 334 million of indirect tax credits in Brazil. In Middle East and Africa, we grew market share and delivered an AOI of EUR 329 million. These strong results were achieved despite the ongoing regional conflict, which resulted in an 8% decline in total industry volumes. In Asia Pacific, AOI was up 35% to EUR 27 million, with industrial cost improvements more than offsetting foreign exchange headwinds. Looking ahead to the rest of the year. As previously stated, we are reaffirming our 2026 guidance as well as our expectation of achieving positive industrial free cash flow in 2027.
Before concluding, I would like to share a few observations regarding the remainder of the year. Our guidance assumes net tariff expenses of EUR 1 billion to EUR 1.2 billion, including the impact of the EPA credit recognized in Q1. This represents a modest improvement from the EUR 1.3 billion previously communicated. Our industrial free cash flow guidance also reflects approximately EUR 2 billion of payments related to H2 2025 charges, of which EUR 0.9 billion was paid during the first half of 2026. CapEx and R&D spending are expected to be 6.5% to 7% of net revenues in 2026, consistent with the approximately 7% outlined in the FaSTLAne plan.
In the second half, we expect financial performance to be weighted towards Q4. Q3 will be impacted by the summer shutdown and continued raw material inflation, while Q4 is expected to benefit from higher volume and a stronger ramp-up of VCP initiatives. I will now turn it back to Antonio to wrap up before the Q&A.
Antonio Filosa: Thank you, Joao. Before we move to the Q&A, I would like to step back and reflect on the big picture. I hope all of you either had the opportunity to attend our Investor Day or to view the presentations online. You will see that our FaSTLAne 2030 strategy addresses in a structured way the core issues that we face as a company and capitalizes on our biggest opportunities. We are fully focused on executing our plan, which will deliver significant benefits as we build a stronger Stellantis for the future. Nothing can be fixed overnight, but I would like to highlight 3 items that are our top 3 priorities. First, market coverage.
Discontinued products from '21 to '25 led to a reduction in our market share, both in North America and in Europe. You have seen early progress in our market share gains this year. FaSTLAne 2030 reinvigorated the product portfolio, getting us to around 90% market coverage in both regions, representing a huge opportunity for growth. Second challenge, industrial cost. We have improved significantly in the past year, and this remains a big opportunity to drive our financial performance. In FaSTLAne, VCP will deliver EUR 6 billion of annual run rate cost reductions by '28. We are making strong initial progress on VCP, and we are on track to implement 40% of the initiatives by the end of this year.
This means that in '27, we expect to enjoy EUR 2.4 billion of AOI benefits plus the partial benefits of the initiatives we implement in '27. Finally, quality. Our execution on quality in the past was not what it needed to be. But we have come a long way already in the last year. Quality has improved significantly by 38% in North America and by 24% in Europe. And FaSTLAne 2030 is giving the quality organization the focus and the resources they need to be in the top quartile in all regions and segments where we compete by '28.
It will take time to fully capitalize on these opportunities, but it is a time frame that is fully embedded in our '26 guidance, in our expectation of positive industrial free cash flow in '27 and in our '28 FaSTLAne targets. The road is long, but we are moving in the right direction with the right priorities and with the right pace. Thank you. We will now ask the operator to open the line for questions.
Operator: [Operator Instructions] And the first question comes from the line of Stuart Pearson from Oxcap Analytics.
Stuart Pearson: Hopefully, you can hear me now, my mistake. Too many calls today. So I guess we have to start with North America and the lack of operating leverage there. Obviously, very strong shipments coming in. Obviously, we've seen, I guess, some of our expectations another weak margin there despite cost support. So I mean, can you just dig into a little bit more why we're not seeing that? Is it pricing that's really eating into that, whichever bucket in the bridge that might really fall into? And what would it really take to get those North America margins up? And what are the building blocks, I guess, into 2027 that can give us some confidence on that?
And I guess one of those sort of partly self-answer, I guess, is going to be the industrial cost drivers. Obviously, a huge benefit there, that EUR 1.9 billion. And obviously, the team deserve credit for that. But maybe you can help us understand what's really in there? What are the examples of actions that are driving that kind of cost tailwind in the second quarter? And should we expect -- or what rate should we expect that to continue in the second half and into 2027? I know you talked about the VCP plan. But could we take the H1 run rate or at least most of it and extrapolate that?
Antonio Filosa: Okay. I will take part of this question, and then I will pass to Joao the rest. So what is happening in North America is, number one, the trajectory is the right one. The trend is the right one. So if we compare AOI of Q2 versus AOI of Q1 net of IEPA refund, then we see a significant and meaningful improvement as we see an improvement in shipments, in market share, for instance. Now it's important to say, to repeat what I just mentioned at my closing remarks. We have a plan FaSTLAne 2030. It is a good, structured and articulated plan.
And this plan addresses in North America and globally, the 3 major challenges that we see in our company. One of those is industrial cost. We have an industrial cost gap, and we are addressing that daily with VCP. And VCP will deliver, as mentioned, EUR 6 billion of cost savings run rate in '28. We are on track to full implement 40% of the initiatives that we have identified and there are many by the end of '26. That means that we -- '26 will enjoy EUR 2.4 billion of cost savings plus all the extra that will come from the additional initiatives that will be executed in '27 itself. So you asked some tangible example.
So VCP, when it comes to cost, works mainly on 3 major drivers in our cost structure. One is direct material cost. This is the cost of component and system and subsystem that we use in our cars. And here, we have 2 leverage, the purchasing leverage to negotiation and the technical leverage to implementation of technical savings. And those technical savings can be many, for instance, new technologies that represent the same or better performances of our products with lower cost. For instance, which of material that keep the performance of the product where they are, but they represent a cost savings, et cetera, et cetera. The second driver is transformation cost.
This is the cost of our manufacturing system in our plants. And on there, we have tons of projects to improve efficiency. And this is why our efficiency in our plants in North America is consistently and meaningfully improving since last year. So you see that today, our efficiency run in around 89%, which is a very good result, and that represents 870 basis points better than prior year. A year, the projects are really thousands. The third driver of cost that VCP addressed through projects and initiatives is logistics and distribution costs. And in this case, also the projects are mainly [indiscernible] . For instance, we are optimizing our routing from suppliers to plants for plants to the yards.
We are increasing the loading of our logistic tools, thus saving costs or simply, we are combining warehouses or we are shutting down warehouses, and we are putting that space in our plants. And this is the third driver of efficiency that VCP will address. Again, with the objective this year, to fully implement by the end of '26, 40% of the main initiative mapped that will deliver EUR 2.4 billion of AOI savings improvement in '27 and then the EUR 6 billion in '28 as a run rate. And Joao, do you want to take the rest of the question?
Joao Laranjo: Yes. So on the industrial cost, the EUR 1.9 billion, slightly more than 70% about EUR 1.4 billion. It's split between purchasing, material cost savings and warranty. On the warranty, the largest piece, it's the recall recorded in Q2 last year in Europe. So most of that is because of the non-repeat. On purchasing, it's the work that we are doing to reduce product costs as we have discussed in the Investor Day. And that is a number that we will continue to see it improving and accelerating as we evolve with VCP.
The other items that are also included on the industrial costs to give context are logistic costs and manufacturing, which we also saw improvements, given the meaningful performance improvement at our plants, as Antonio mentioned on the opening remarks. And we also see benefits on manufacturing costs because of the higher volumes. So there's items that are temporary and also depends on the comparisons year-over-year. But we should expect to see material cost savings to continue to progress in the second half and beyond. And just to also remind that we expect that raw material continues to be a headwind and growing in the second half versus what we saw in the first half, including Q2.
But yes, we see a lot of positives on the industrial costs and especially on the material cost, and we expect to build momentum on that.
Stuart Pearson: And sorry, on the operating leverage side in Q2 in North America, just because 400 million volume and mix implies quite a negative mix in there, I guess, in Q2. Is that fair? In North America, sorry.
Joao Laranjo: No, the mix was not very negative. Some of that is channel and product content. But the operating leverage of Q2 is consistent with the margins that we have had on the previous quarters. And to Antonio's point, we -- that is a gradual exercise that we're going to improve as we work on costs and also on warranty. But there was nothing -- anything exceptional to that is bringing the operating leverage in North America other than the challenge that we have in cost and quality that Antonio already mentioned.
Operator: The next question comes from the line of Thomas Besson from Kepler Cheuvreux.
Thomas Besson: I have a question about the shape of H2. I think you're coming out of relatively easy comps in terms of volumes in the first half. It becomes a bit more difficult in the second. Could you help us understand exactly what you're aiming for in terms of quarter-on-quarter or H2 and H2 improvement? Are you going to try to improve on the reported minus 1.7% AOI of H2 last year? Or are you going to try to improve on the 0.9% underlying AOI if we excluded the EUR 2.1 billion unusual item that you couldn't remove in the second half of the last year?
And what will be the drivers of improvement as it will be less driven by volumes and as you will face more headwinds from raw materials?
Joao Laranjo: Yes. So the -- our target for H2 is to deliver the best results possible, aligned with the full year guidance. So we are not setting any specific targets for the H2 on this call. The dynamics that we're going to see on the -- that we expect to see on the second half as the first half, it's a headwind of about EUR 1 billion between raw material and then the non-repeat IEPA credit that we recognized in Q1. And volume should be lower as we saw, we build up inventory in the first half, and we expect, as Antonio mentioned, to reduce inventory in the second half. But then we expect to see positive mix.
We expect price to be constructive, especially in North America, and we expect to continue to make progress on cost reduction. So those are the puts and takes for the second half -- first half performance.
Thomas Besson: Can I add a follow-up, please?
Joao Laranjo: Yes, please.
Thomas Besson: Okay. Great. On the North American business, to follow up on Stuart's question, your truck mix has been extremely strong in H1, and we still don't see a lot of traction. Could you help us understand what is still -- I mean I understand your costs are not where we'd like to be, quality is not perfect yet. What are the main negative drivers to your NAFTA margins? Is that channel mix? Is that relative pricing as well? Or is it just your industrial cost and some remaining quality issues?
Antonio Filosa: Yes. So I will take this question, and then I will pass Joao for additional info. So as I mentioned in my closing remarks, our plan, which is a good plan, address in time the major challenges that we see, right? And calling on North America, for sure, we have a quality gap that translates into warranty cost and campaign cost. And this have been addressed with a very vast quality turnaround plan, which on the new product is already delivering a much improved product quality, 38% improvement in 3 months in service year-over-year.
And then the second challenge that the plan addressed is a cost gap, as you mentioned, which we are addressing with VCP with the trajectory that I already stated, EUR 2.4 billion to start in '27, plus all the additional initiatives that we'll implement in '27, up to EUR 6 billion cost saving run rate in '28 and forward. Those are the 2 things that FaSTLAne address in North America and globally at the pace and in time, which is already embedded in all our targets, in the '26 financial guidances that we reaffirm, in the '27 free cash flow positive that we reaffirm and in '28 targets that we distributed in FaSTLAne 2030.
The notional time and the time frame needed is already embedded in the plan, and we are executing and delivering as we showed in quarter 2, accordingly to the plan. We are on track. Joao?
Joao Laranjo: I don't have anything else to add, I don't think.
Operator: The next question comes from the line of Jose Asumendi from JPMorgan.
Jose Asumendi: Antonio, just one question, please, again, on the North American margins. And I'm just wondering, is there a very large opportunity to increase the utilization, the loading of the plants in North America, which then in turn would unlock the PCP cost savings, right? But then when I think about this, you need to win market share in the U.S., you need to increase production by, let's say, 150,000 units from here, right? I mean when I look at the capacity of your business and I compare it a few years from now, there's a very large opportunity to increase production.
So can you help me understand a bit better, please, which product cycle, which vehicles are going to drive this increase in production in North America, which I think will drive these cost savings across, again, PCP and loading of the plants, which I think is -- when I go back again to the operating leverage, why are we not seeing the operating leverage, it must be because the loading of the plants is low. I would love to hear your thoughts, please. And correct me, please, if I'm wrong.
Antonio Filosa: Thank you. Thank you very much, Jose, for this relevant question. So here, again, I need to give the notion of what we are doing and on time and on the time that is embedded in the plan itself. So we know that we have a product gap, as you mentioned. And this product gap obviously hurted in the past that we are recovering market share in North America not only and obviously, capacity utilization. Now we are currently developing very competitive and successful products that we will deliver in high volumes starting from '28. So those are the steps.
The step is now we focus on improving quality by daily and focused execution by improving industrial cost as we are doing by daily and focused execution. Both are happening, and we need to accelerate more. And those will remove warranty costs and campaign cost together with, obviously, increased cost savings and industrial efficiencies. Said that, at the same time, we are introducing and we will introduce more of the new products. So we introduced already some, as you see, the Ram TRX SRT that will be a great profit contributor has been recently introduced and distributed to our dealers just 6 months after unveiling.
We are developing and we will launch this year Jeep Recon BEV, Jeep Grand Wagoneer REV. And then the high-volume products that we are executing in develop now will be delivered to the market by end of '27, starting from '28. So the steps are those, quality improving, warranty cost and campaign costs removed, cost improving, cost savings into our business, improving commercial efficiency with the lineup that we have, the new products we are introducing to increase volume and saturation and then the big products that are coming by end of '27, starting of '28. Joao, do you want to add something?
Joao Laranjo: No. Thank you, Antonio.
Operator: The next question comes from the line of Emmanuel Rosner from Wolfe Research.
Emmanuel Rosner: My first question is on the second half puts and takes that you provided before, which are extremely helpful. So I understand a lot of the headwinds around raw materials, non-repeat of EPA, the volume destocking. I was hoping you can just give a little bit more color on some of the tailwinds. What will drive the positive mix in the second half, the positive U.S. pricing in particular?
Antonio Filosa: Yes. I'll start to take the answer, and then I will give the word to Joao. So the headwinds that we see are the ones that Joao explained. So we see inflation coming. We see a memory chip shortage. And we see, especially in quarter 3, lower shipment driven by the shutdowns, both in Europe -- seasonality in Europe and in North America. Then when we project to half 2 and quarter 4 specifically, the major 2 tailwinds will be, one, again, VCP. So we are meant to implement 40% of the initiative that we have mapped by end of '26.
That means that in quarter 4, we will start enjoying an acceleration of cost savings coming from there, for sure. And then we see a constructive environment for pricing in North America specifically. And obviously, we will take that as much as possible. Joao?
Joao Laranjo: Yes. So on the mix, there are 2 things. One will be channel mix, given the seasonality of rental sales, both in North America and Europe more heavily in the first half of the year. And also as we introduce new vehicles here in North America, in other regions as well, we see benefits of mix. One obvious example is the Ram TRX. On pricing, given the inflation pressures and the raw material inflation that everybody is expecting in the second half, we see constructive price again in North America and then stabilization in the other regions. And the third one that is very important, it's acceleration of cost reductions, as Antonio mentioned.
But those are the -- so it's really operational drivers and that we are working every day to improve our business efficiencies as we develop the new products that Antonio was mentioning before.
Emmanuel Rosner: My follow-up question is, would you be able to describe for us the competitive environment and traction you're seeing in the full-size pickup market in the U.S. Your inventories of Ram are particularly elevated, I think, around 110 days at the dealers. There are some media reports on some pretty large incentives being offered in the month of July. So just curious how much market traction you're seeing? And yes, could you describe the competitive environment for us?
Antonio Filosa: Yes. I will take the first part of the answer. And I must say that I'm very happy with Ram 1500 trajectory. So Ram 1500 specifically, which is a cornerstone as a product for the Ram brand, it was declining steadily in the previous year. And then after the introduction of the Ram HEMI V8 engine, then it started climbing up again. In July, it's crossing the line of 20% plus segment share and has been gaining segment share and market share since 12 months ago. Joao, do you want to take the other?
Joao Laranjo: Yes. So the -- specifically on the Ram light duty, what we have on the '26 model year, it's a normal model year transition. And again, we are constructive on pricing on the second half. So this is the price position that we have on the Ram light duty right now is specific on the transition of the model year, and we are definitely taking advantage of the strong position that we have on that car, including the stock to accelerate sales as we transition the model year.
Operator: The next question comes from the line of Michael Foundoukidis from ODDO BHF.
Michael Foundoukidis: So 2 questions on my side. First on VCP. Of the EUR 2.4 billion of VCP benefits that are expected in 2027, how much should flow directly to AOI versus being reinvested into pricing and market share gains? And second question, maybe on North America and following up on your previous answers. How much of North America margin recovery would you consider depends on higher utilization from new products arriving in 2027, 2028 versus cost reduction alone?
Joao Laranjo: Okay. On the VCP, the 2.4 billion savings, we expect all of that will flow to AOI. And then on the second one, the biggest items to improve the AOI in North America are material cost and quality improvement. Plant utilization, it's important, and we are seeing already some efficiencies, but the magnitude of purchasing material cost efficiency and warranty is much, much larger than any efficiency that we can get on better utilization of the plants.
Operator: The next question comes from the line of Philippe Houchois from Jefferies.
Philippe Houchois: Two questions on product more. One is on the Cherokee. There was a lot of hope Cherokee would make a difference to market share. We don't really see it. And I know there may be some production issues, but I'm trying to understand, are you deemphasizing the products because it is not as meaningful to profitability and then it needs to be somewhat redesigned? Or is it because the tariff in Mexico made it uncompetitive? And in that scenario, any particular expectation of USMCA evolving? And at one point, would you be transferring production of Cherokee to Belvidere if that is the case? And is that the answer to Cherokee being a more meaningful contributor to volume and profitability?
And the other question I have on product still, but more on the European side is Leapmotor. So we've seen good volume from Stellantis in Europe, but we see negative volume mix impact. I understand the mix can be negative. I'm trying to understand how much of a contribution we would expect from Leapmotor. And to what extent my understanding of the Leapmotor setup and the cost efficiency is that the product could be dilutive to the mix of Stellantis, but still be accretive to earnings. And is that still the right approach? And when do we start to see that show up in the profitability of Europe?
Or do we have to wait for eventually the Peugeot brand to start coming through and contribute more positively to mix as was the case in the past?
Antonio Filosa: Okay. So I will split the question into 2. I will take the Cherokee question, and I will pass to Joao the Leapmotor question. So on Cherokee, first of all, we see high interest from consumers on Cherokee. We map that every time on the funnel management and interest is very high. What we are doing, as you said, it is very exposed to tariffs. So we are balancing volumes with profit generation. We are doing that by limiting some trims and mixing on the highest and more profitable trims and limiting some channel, so improving the quality of the mix channel. This is what is happening now in Cherokee.
What we are doing in parallel is to put it into VCP. So it will be one of the nameplate that will receive the cost savings that we are identifying, mapping and implementing. We are introducing more competitive trims. This will happen in half 1 next year. And then as you mentioned, we are repatriating Jeep Cherokee into Belvidere. And that will make Cherokee tariff-free, almost tariff-free. On Leapmotor?
Joao Laranjo: Yes. So Leapmotor, it has been so far very successful. The vehicles are profitable. But as you mentioned, because of the powertrain mix of those vehicles, they have margins that is lower than the average in Europe. But we continue to expect positive contribution and increasing contribution from Leapmotors as we launch new vehicles and expand the portfolio in Europe. So, so far it's very successful. And again, it's profitable, but definitely has a negative impact on mix because of the powertrain.
Philippe Houchois: Understood. If I can squeeze in for back to Antonio, but do you have a date for when Belvidere would start production of the Cherokee, please?
Antonio Filosa: No, we cannot unveil this date in this call.
Operator: The next question comes from the line of Christoph Laskawi from Deutsche Bank.
Christoph Laskawi: I'd like to ask on cash generation in the second half. Now obviously, you point to Q4 being better than Q3 and CapEx ramping up quite a lot. Could you comment on the CapEx phasing? Will it start in Q3 right away with higher spending? Or is it mostly Q4? And with working capital reversing or likely reversing in Q3, should we prepare for free cash flow, which is an outflow of over EUR 1 billion-plus in Q3? Any comment on free cash flow phasing would be appreciated.
Joao Laranjo: Yes. No, thank you for the question. The first comment is that if we look at the second half versus first half, we expect to have higher CapEx, and we expect the higher CapEx to pick up already in Q3 and then Q4 again. So we'll see a gradual improvement as we continue to develop the new programs that were set under FaSTLAne 2030. For the second half, we expect working capital to be again positive as usually happens at the end of the year as we reduce especially property stock.
On seasonality between Q3 and Q4, you're right that working capital in Q3, it's negative, and you will have the same -- not the same amount, but the same dynamic that happened last year because of the summer production shutdowns, both in North America and in Europe. So Q3 it's normal that the working capital is negative and it will be the same this year.
Christoph Laskawi: And if I may, a follow-up just on Europe. You mentioned other regions pricing stabilization. Is this seen in Europe? Or is it actually the competitiveness accelerating given the inflow of low-cost competitors in the market? And do you expect the pricing pressure in H2 essentially to be offset with the industrial savings?
Antonio Filosa: So the industrial savings will have an important role, both in North America and as you mentioned, in Europe. The pricing environment will be constructive in North America, and we believe not deteriorating in Europe. And in the other region, we believe that as well, VCP and industrial savings will be a major lever. We see some opportunity of pricing in the other regions.
Operator: The next question comes from the line of Itay Michaeli from TD Cowen.
Itay Michaeli: Two quick questions for me. First, I was hoping you could maybe share how you're thinking about targeted U.S. inventory levels by year-end, whether it's days supply or absolute units. And then secondly, as we think about the achievement of positive industrial free cash flow in 2027, I was curious kind of what kind of volume growth or revenue growth you roughly might need to get to that level of free cash flow next year?
Antonio Filosa: Okay. So I will answer to the question of the U.S. inventory. So I said, we peaked in June at 390,000, moving from January to June, plus 70,000. 65,000 of those 70,000 are new products that we expect to accelerate in sale in H2. And then also the anticipation of buildup for the planned summer shutdowns in our North American plant. July sales rates are already moving the inventory largely down. So we believe that we will end July as U.S. dealer inventory at around 365,000.
And moving forward, we believe that this absolute number can be the one that will allow us to accelerate the sales that we want to do and also introduce the new products that we are doing, such as the Ram TRX SRT, which will be very profitable and very positive for mix, the Jeep Recon BEV and the Jeep Grand Wagoneer REV. Joao, do you want to take the other one?
Joao Laranjo: Yes. So the in FaSTLAne, we set the revenue target for 2028 at EUR 175 billion. So the revenue that we are expecting for '27, it's intermediate between what we're going to close 2026 and the 2028 target. So it's reasonable volume growth on the back of the products that we continue to launch. The biggest driver for the positive free cash flow next year is the earnings. Volume will be a part of that. But the biggest part of the earnings growth next year, as we are talking many times here, it's industrial efficiencies, including the savings that we expect from VCP.
So industrial costs and industrial efficiency will be the biggest driver of the earnings improvement next year that will drive to the positive free cash flow.
Operator: The next question comes from the line of Christian Frenes from Goldman Sachs.
Christian Frenes: I just want to come back to North America again and specifically on the volume and mix portion of the bridge where you reported EUR 409 million of benefit. That's down sequentially. And I'm just wondering the drop-through. If I look at the drop-through from Q1, I think you were 27% on that line item and it's now dropped to 8%. So I'd just like to understand again if there were any sort of specific reasons for that or if the recalls, I think you mentioned the recalls were also present in North America.
And I'm not sure if raw mats would come into this line item, but if you could flag any reason for that significant sequential drop in volume and mix drop-through? And then secondly, on the vehicle net price also sticking with North America, we went from a positive number in Q1 to a negative number. And just trying to understand, especially on the content side, what happened there and how we should think about the second half?
Joao Laranjo: Okay. On the sequential drop-through impact, the biggest driver of the Q2 versus Q1 mix deterioration is nameplate mix as we increased shipments of some of the vehicles built, especially in Mexico. So basically, the increase of vehicles built in Mexico were the ones. So it's basically nameplate mix based on the vehicles that we shipped in Q2. So nothing special other than a specific time of the mix that happened in Q2 versus Q1.
Christian Frenes: Okay. That's really helpful. And then if I could just have a follow-up question on your investment spend. I think you're keeping your investment spend for the full year, still intact. And if my calculations are right, in H1, you spent about EUR 3.5 billion, which would imply H2 spend -- investment spend of about EUR 7.4 billion or thereabouts. That's a very significant increase H1 to H2, which we didn't actually see in the last 2 years. So again, could you help me understand why there's this significant shift or perhaps I'm making an error in these numbers?
Joao Laranjo: Yes. We can take this offline because I think some of the numbers that you're taking, you're probably not capturing all the perimeter. In H1, our total investment as a percentage of revenue, and we can reconcile offline, it was 6.3%. So we -- yes, so there is over EUR 1 billion of higher CapEx in the second half versus first half. That's what we are expecting.
Operator: Ladies and gentlemen, this was the last question for today. With this, let me now hand the call back to Mr. Antonio Filosa for the conclusion.
Antonio Filosa: Well, very, very well. And thank you again for joining us today and for the time and focus you have put into reviewing our results and listening to our business updates. Thank you again, and see you next time. Bye-bye.