3D printing stocks are having a strong year in 2017 after several years in which most of them took a pounding. This has caused an uptick in interest in the group among investors.
If you're considering investing in 3D Systems (DDD +8.60%), these seven charts should help get you up to speed on the company and its stock.

Image source: Getty Images.
Stock performance: A roller-coaster ride
Like most of the 3D printing stocks, 3D Systems' stock has been on a roller-coaster ride for several years. The stock is performing powerfully in 2017, through June 21, as the following chart shows. (For context, included are Stratasys, the industry's second-largest player by market cap, and the S&P 500.)

Data by YCharts.
3D Systems stock also had a very good 2016, gaining nearly 53%. Since Jan. 1, 2016, the stock is up 148% through June 21, an almost 18-month period.
However, the narrative for 2014 and 2015 was ugly, as the chart below shows. The stock fell just as quickly as it had soared in the preceding two years, as investors' stampede into 3D-printing stocks resulted in sky-high valuations that weren't justified by the company's financial performance. The industry has enormous promise, but expectations got too high, too fast.

Data by YCharts.
Business breakdown
Here's a snapshot of 3D Systems' business broken out by its two reporting segments:
|
Segment |
Q1 2017 Revenue |
Q1 2017 % of Total Revenue |
Revenue Change (YOY) |
|---|---|---|---|
|
Products |
$94.7 million |
60.5% | 4.1% |
|
Services |
$61.7 million | 39.5% | 0% |
|
Total |
$156.4 million | 100% | 2.5%* |
Data source: 3D Systems. YOY = year over year. *Revenue growth got a boost from an acquisition in the quarter. Organic revenue growth (which excludes acquisitions made in the last year) is estimated in the 0.5% to 1.5% range.
When it reports earnings, 3D Systems also typically provides year-over-year revenue growth for several categories that either span both products and services or fall within one of its two segments.

Image source: 3D Systems. Healthcare solutions includes both products and services; materials, software, and 3D printers are categories within the products segment; and on-demand parts is a services operation.
3D Systems' healthcare business has generally been a bright spot over the last few challenging years.
Revenue story: Fast growth came to a halt in 2015

Data by YCharts.
Since 2015, 3D Systems has struggled to grow revenue, as has Stratasys and most other 3D printing companies. One reason for the slowdown in demand for its products likely is that overcapacity in the field resulted from the robust sales of 3D printers in the few years preceding the downturn. Additionally, some companies probably put off buying decisions to see which 3D printers would be offered by expected new market entrants such as HP Inc. and well-funded start-up Carbon, both of which entered the market last year.
There's another significant reason for revenue growth coming to a halt: 3D Systems is no longer acquiring companies like gangbusters, which it did in the stock's heady years. This is a good thing, as this incessant acquisition activity probably resulted in top management not paying enough attention to growing its existing business through innovations.
Earnings story: Follows in suit with the revenue story
3D Systems' revenue contraction over the last couple of years has naturally negatively impacted its earnings. Earnings were also hurt by the company taking charges for discontinuing its consumer-facing businesses. While earnings per share (EPS) based on generally accepted accounting principles (GAAP) remains negative, the company has made solid progress in improving EPS. Moreover, while EPS remained negative in Q1, management has guided for positive EPS for full-year 2017.
Much of the recent improvement in earnings stems from cost-cutting. Increasing efficiency is a great thing, but it can only take a company so far. 3D Systems will need to grow revenue if it wants to increase earnings over the long term.
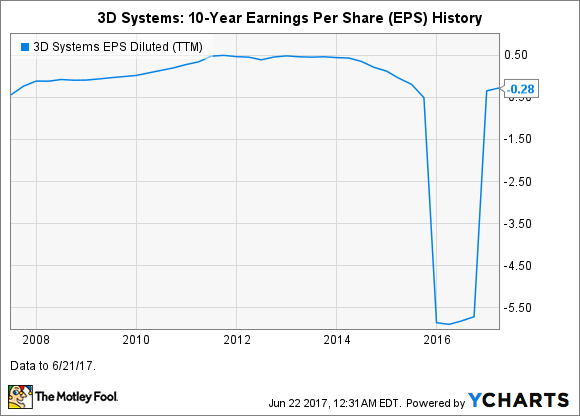
Data by YCharts.
Stock valuation
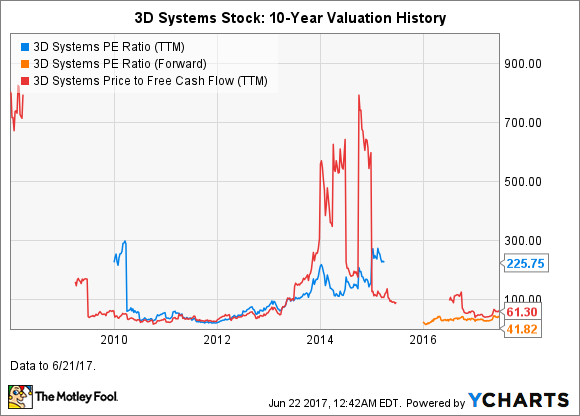
Data by YCharts.
3D Systems isn't profitable on a GAAP basis, so it currently doesn't have a price-to-earnings (P/E) ratio based on trailing-12-month earnings. You can see in the preceding chart that back in 2015, investors drove the P/E up to levels over 200! So it's not surprising that the stock dropped like a rock when the torrid earnings growth that investors were betting on never arrived.
The stock has a forward P/E because Wall Street is projecting that the company will post positive EPS for full-year 2017. The forward P/E of 41.8 is high, especially for a company that is still in a turnaround state.
3D Systems is currently generating positive free cash flow (FCF) despite posting negative GAAP earnings, which is a big positive. That said, a P/FCF ratio of 61.3 is very high.
Wrapping it up
3D Systems is making some solid progress in its turnaround efforts, and it's a significant positive that the company expects to return to GAAP profitability for full-year 2017. While there's reason for cautious optimism, investors should not throw caution to the wind. The stock's valuation based on both forward earnings and FCF is high.