Real estate investment trust (REIT) Simon Property Group (SPG 0.54%) owns malls, and that's been a rough business lately, with retail store closures and bankruptcies filling the headlines. That trend even has a catchy, and frightening, nickname: the "retail apocalypse." Investor concern over the retail apocalypse is one of the key reasons why Simon's stock has fallen by a third from its 2016 highs. But don't count Simon out -- here are five charts that help show why it may be a diamond in the rough today.
Strong assets
There are only around 1,200 enclosed malls in the country, and a couple hundred outlet centers. Simon's roughly-200-mall portfolio spans both categories. Add in that it also owns foreign assets, and it is easily more diversified than most of its peers. However, just owning a lot of malls in different places isn't what sets Simon apart. It also happens to own well located assets, and as the old saying goes: location, location, location.

Image source: Getty Images
Take a look at this graphic from competitor Taubman Centers (TCO) showing average sales per square foot and rent per square foot for competitors in the mall REIT space. Although not in the number one spot, Simon's sales per square foot of roughly $660 makes it one of the industry's top players, as does its average rent per square foot of about $54.

Image source: Taubman Centers
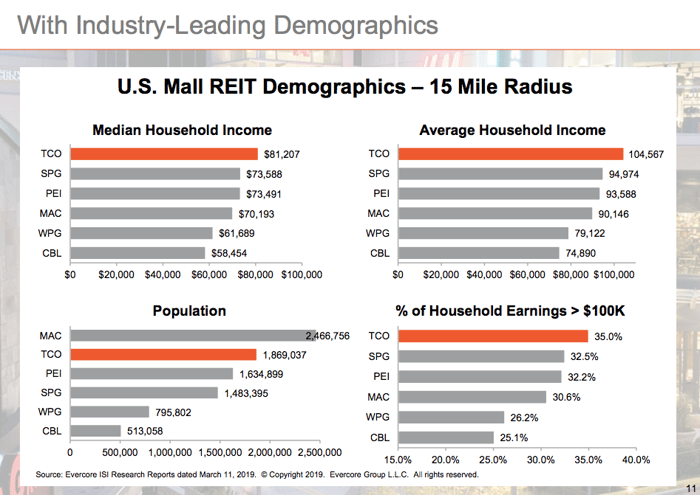
Why is that? Because Simon has well located assets in prime markets. As the graphic below shows, Simon's properties are generally located near large population centers filled with extremely wealthy families. Here Simon lands in the number two spot for average and median household income, and for the percentage of families earning over $100,000 in the areas around its malls. These are the types of people who can afford to shop.

Image source: Taubman Centers
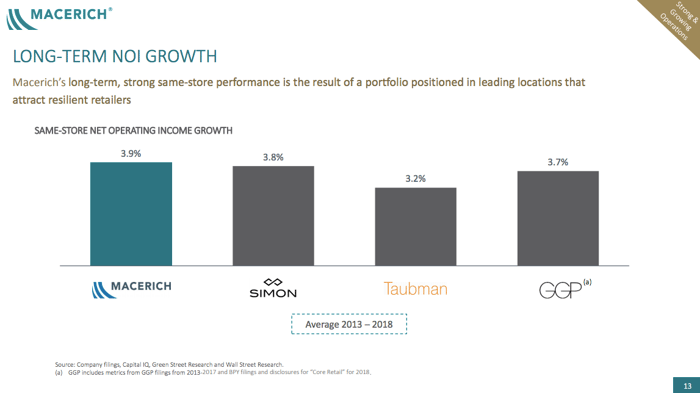
Having malls in good locations is one of the reasons why Simon has been able to grow same-store net operating income right in line with its closest peers. Although Simon's NOI growth of 3.8% between 2013 and 2018 isn't the best number shown in the graphic below, created by competitor Macerich (MAC 0.06%), it's just 10 basis points shy of Macerich's 3.9%.

Image source: Macerich
There's another fact that should be clear from these three graphics provided by Simon's top competitors: Simon's portfolio isn't the best positioned. That's why Taubman and Macerich provided them to investors. However, Simon's portfolio is right up there with those of both of these companies, and frankly much better positioned than the rest of the pack.
However, while location is very important, it isn't the only issue to look at.
A strong foundation
Not only does Simon easily compete with the best positioned players, location-wise, in the mall space, but it also has one of the strongest balance sheets. Leverage is a powerful tool when things are going well, but it can make running a business a lot tougher when things aren't going so well. And right now, during the retail apocalypse, the operating environment for malls is difficult, even though the impact is likely being overhyped. Simon, Taubman, and Macerich are currently working to revamp space to deal with closing stores so their malls remain attractive to lessees and shoppers. That takes both time and money.
Examine the following chart comparing the mall REITs on financial debt to equity and you'll see some big differences. Simon is way down on the bottom with a financial debt to equity ratio of roughly 0.6 times. That's about half of Macerich's 1.1 times, and roughly a third of Taubman's 1.5 times. Simon has a lot more leeway on its balance sheet to fund the costs of improving its centers than either of these peers.
SPG Financial Debt to Equity (Quarterly) data by YCharts
Having looked at that chart, it might not be surprising to see that Simon also easily leads the pack when it comes to covering its interest costs. Simon's times interest earned ratio of 4.3 times or so puts it well above the pack. Macerich and Taubman, with times interest earned ratios of 1.6 and 1.2, respectively, are cutting things a lot closer. Simon's additional leeway here means it has more cash available to reinvest in its malls.
SPG Times Interest Earned (TTM) data by YCharts
At the end of the day, Simon comes out well on both sides here. It has good malls in good locations, and a strong financial foundation from which to deal with the retail apocalypse. Taubman and Macerich also have good malls in good locations, but neither has the balance sheet strength that Simon does. That gives Simon a clear edge.
Going with the best
Simon is generally considered the best-run mall REIT. The five charts above show why. That said, one area where Simon falls short is dividend yield. Its 5.5% yield is well below the 7.7% offered by Taubman and 11% from Macerich. Those high yields may be enticing to some, but for dividend investors who prefer to stick with financially strong companies, Simon's industry-leading balance sheet will easily put it on the top of the list. In the end, location is important for mall REITs, but so is a company's financial foundation. Simon is the best mix of both.


