The U.S. economy entered its first recession in over a decade in February, and many investors might be inclined to stay on the sidelines. And it's not hard to see why -- during recessions, the market tends to take investors for a roller-coaster ride.
The current recession that resulted from the COVID-19 pandemic is no exception. Nine of the 10 largest single-day point gains and eight of the 10 largest single-day point drops in the S&P 500 have occurred since February. And all 10 of the largest intraday point swings of all time in the S&P 500 occurred in March.
It's common knowledge that nobody can accurately predict the day-to-day direction of the stock market, but when 5% moves in either direction are happening regularly, it can be quite nerve-racking to even think about putting new money to work.

Image source: Getty Images.
How investing in recessions has worked out in the past
Let's take a quick look at how the stock market performed during three recessions in recent history: the recession in the early 1990s that followed a long economic expansion in the 1980s, the 2001 recession that followed the dot-com bubble and was also fueled by the Sept. 11 attacks, and the Great Recession that started in 2007 and ended in 2009.
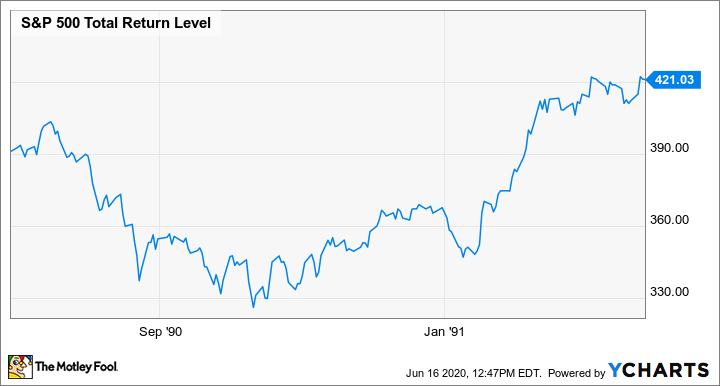
1990-1991 recession
After almost eight years of strong economic growth, the U.S. economy entered recession in July 1990 and emerged in March 1991. And this recession was a pretty straightforward one in terms of market performance, with a clear dip followed by a recovery:
2001 recession
Unlike the previous example, the 2001 recession wasn't just one dip. Stocks dropped considerably when the recession began, then rallied, and ended up plunging after the September 11 attacks:

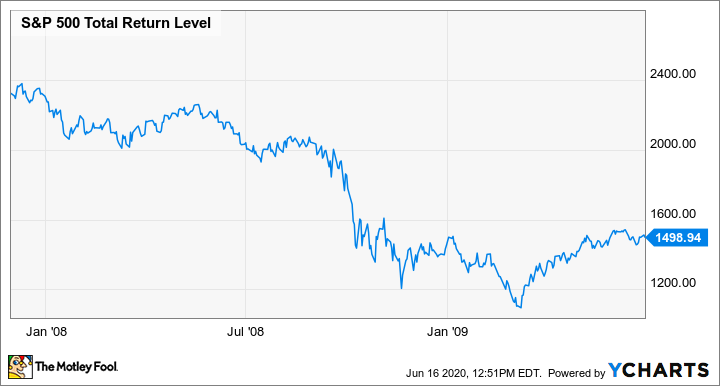
The Great Recession
As the subprime mortgage crisis started to become apparent, the stock market began a steady downward trend. Then, as large investment banks began to teeter on the brink of collapse in late 2008, the market fell off a cliff, finally bottoming out in 2009.
How did stock investors do long-term?
Now, let's take a look at how investors who put money to work in these recessions did. We'll look at the annualized total return of an investment in an S&P 500 index fund made at the best possible time in each recession (at the market's low point) as well as the worst possible time (at the market's peak).
|
Recession |
Annualized Return From Low Point Through June 2020 |
Annualized Return From High Point Through June 2020 |
|---|---|---|
|
1990-1991 |
10.6% |
9.8% |
|
2001 |
8.5% |
6.8% |
|
2007-2009 |
17.4% |
8.4% |
Data source: YCharts. Total returns as of June 16, 2020.
Here's the point: First of all, even if you had invested at the worst possible time during the past three recessions, you would have achieved a 6.8% annualized return since 2001. For context, this means that a $10,000 investment would have grown to about $35,000 in 19 years, and that's with the worst timing possible.
Second, notice how the timing matters less and less as time goes on. While anyone who bought an S&P 500 index fund during the Great Recession has done quite well, the difference between good timing and bad timing is substantial. However, that was just over a decade ago. When you look back at the 1990-91 recession nearly 30 years later, the difference between the best and worst possible returns really isn't too much. Investors who got in at the worst and best possible times both did comparably well over the long run.
Keep your eye on the long term
Here's one concept that all long-term investors should know in recessions: You aren't likely to catch the market at the bottom.
Generally speaking, timing the market is a losing battle. The best thing you can do during a recession is to put your money to work in excellent businesses and hold on for the long term. As you've seen, even if you invest at the worst time during recessions, it has historically been a pretty smart time for buy-and-hold investors to add stocks to their portfolio.


