Imagine you're a modern-day version of Rip Van Winkle, but instead of sleeping for 20 years, you fell asleep in early January 2025 and woke up in early June. The S&P 500 (^GSPC +0.52%) would be a little higher than when you dozed off. You probably would think you didn't miss much, at least where the stock market is concerned.
The reality, of course, is that a lot happened with stocks during the first five months of the year. The S&P 500 plunged roughly 19% below its high before rebounding strongly.
The widely followed index is now near its all-time high. What does history say might be next for the stock market?

SNPINDEX: ^GSPC
Key Data Points
Looking back
The S&P 500 was introduced in its current form with 500 companies in March 1957. By my count, there have been a dozen times in the past when the index fell roughly as much as it did earlier this year.
In three of those cases, the S&P 500 bounced back much more slowly than it has in recent months. For example, in late 1973 and early 1974, the index entered into a prolonged bear market, and the S&P didn't regain its previous high until 1980.
Other extended downturns occurred in the early 2000s after the dot-com bubble burst, and the financial crisis of 2007 through 2009. The S&P 500 also fell sharply in 2022 and didn't fully recover until early 2024.

The S&P 500 didn't immediately rebound several other times. The index's first steep sell-off in its current form provides a great case in point. The S&P briefly entered a bear market in 1957 and didn't fully claw its way back until September 1958. Similar trajectories occurred in 1962-1963 and 1966-1967.

However, the S&P 500's resurgence was faster in other cases. For example, stocks plunged close to 25% in mid-1970, but by early 1971, the S&P regained its previous high. The index continued its momentum for a few months before becoming range-bound.

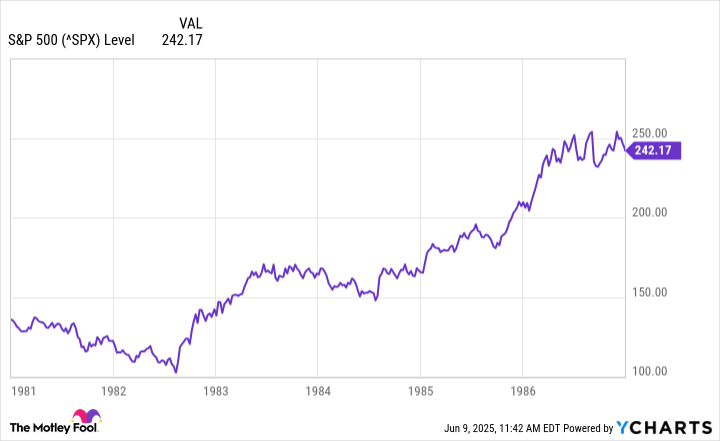
The S&P 500 declined significantly in 1981 and 1982. Its rebound was especially strong, though, and led to a multiyear bull market. Likewise, the sell-off in 1990 set the stage for a quick comeback and roaring market throughout much of the next nine years.
Which precedent is most like the present?
I think two historical precedents are especially noteworthy, and one occurred during the first Trump administration. The S&P 500 sank nearly 20% in 2018. President Trump's trade war with China was one of the key factors behind the decline. However, stocks soon rebounded and went on a tear in 2019 as trade worries subsided and the Federal Reserve cut interest rates.

The stock market plunge resulting from the COVID-19 pandemic in early 2020 also looks similar in some ways to the S&P 500's performance this year. Stocks quickly sank but also quickly bounced back as investors saw opportunities to buy at a discount.

What's next for stocks?
There isn't a clear historical pattern for how the S&P 500 will perform after falling 19% or more. However, previous quick rebounds in the past, like the one we've seen in recent months, have often led to sustained momentum.

Image source: Getty Images.
The big wild card today is what will happen with President Trump's tariffs. If favorable trade deals are made with major trading partners, the S&P 500 should soar. I think a similar outcome is likely if the federal courts overturn the Trump administration's tariffs. On the other hand, should the president ultimately levy steep tariffs against China, the European Union, and other countries, the chances of another S&P 500 sell-off will be higher.
The good news for investors, though, is that history looks very encouraging over the long term. The S&P 500 (and its predecessors) have delivered positive average annual returns in every rolling 20-year period since 1928. If you're a long-term investor, history is on your side.