We're less than two months away from the end of the year, and 2025 is shaping up to be another historic one for U.S. stocks. All three major indexes -- the S&P 500, the Nasdaq Composite, and the Dow Jones Industrial Average -- have produced double-digit percentage gains so far this year on top of their massive gains in 2023 and 2024.
Those returns were fueled in large part by the market's excitement around artificial intelligence and the "Magnificent Seven," a group of megacaps that, by virtue of their size, hold tremendous weight in the S&P 500 and even more in the Nasdaq. But companies tied to AI are far from a sure thing. And given the influence of those companies over the overall market, economist Robert Shiller has an important message for investors.
"History offers a cautionary tale: past technology booms produced only a handful of long-term winners," he wrote in his most recent quarterly market forecast published by annuity specialist firm Annexus. "Anytime a group of stocks gets a name or becomes a meme, this is a sign of, at least temporarily, a strong narrative, as in the late 1990's and today."
Shiller, who won the Nobel Prize in economics for his work in developing a framework for predicting long-term returns for assets such as equities or single-family homes, famously called both the dot-com bubble and the housing bubble. He doesn't deny that AI has the potential to transform the economy.
However, he suggests that it could take years before AI actually starts to deliver substantial productivity gains. Meanwhile, over the next decade, many of the biggest winners of recent years could fall considerably. And over that time, he thinks U.S. stocks, as a group, could struggle to perform up to current market expectations.

Image source: Getty Images.
Shiller's long-term forecast for the S&P 500
Shiller's long-term equity forecasting model is based on his cyclically adjusted price-to-earnings ratio, known as the CAPE ratio or the Shiller P/E. The CAPE ratio looks at earnings from the past 10 years and adjusts them for inflation. It then divides the current market price by the average of the inflation-adjusted earnings. The indicator effectively smooths out the impact of the market's cycles, providing a clearer picture of where valuations stand in a historical context.
Today, the CAPE ratio sits at its second-highest level in history. It reached 39.5 at the end of September. After a strong performance in October, the ratio climbed well above 40. The last time the CAPE ratio climbed above 40 was in 1999, as it neared the peak of the dot-com bubble. So, it's not just the narrative that echoes the 1990s, it's the market's valuation, too.
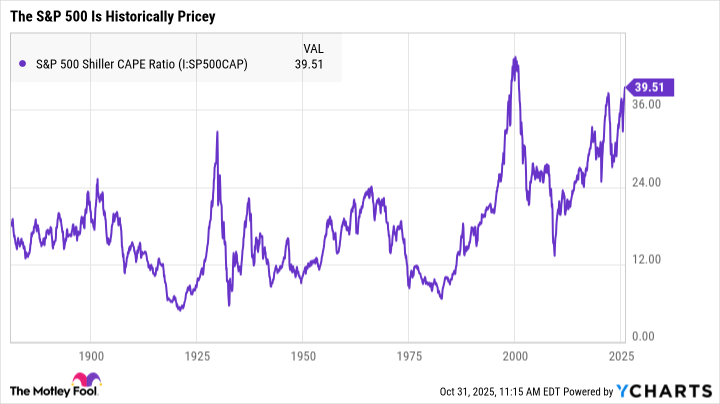
S&P 500 Shiller CAPE Ratio data by YCharts.
Shiller factored the climbing CAPE ratio into his long-term forecast for the S&P 500. And as of the end of September, he expected nominal (not inflation-adjusted) average annual total returns for the index of just 1.5% per year over the next decade. When you subtract the average historical dividend of 2% from those returns, Shiller's actually expecting the index level to decline over the next 10 years. That's another potential echo of the 1990s, which preceded the so-called "lost decade" of the 2000s.
That 1.5% forecast is just the expected return based on Shiller's model. Shiller also provides a range of potential outcomes within a 95% confidence interval. That range is pretty wide, going from annualized returns of negative 7.7% to 10.7%. Still, investors should be prepared to receive far lower than average returns from something like an S&P 500 index fund over the coming period.
The good news is that Shiller points out that there are still attractive opportunities in the market.
Finding value in today's market
The S&P 500 isn't the only index for which Shiller calculates the CAPE ratio. He also does a quarterly checkup on the MSCI Europe Index and MSCI Japan Index. Those two indices track the total market of European and Japanese equities, respectively. And in those markets, he finds much more attractive valuations.
The European index traded at a CAPE ratio of just 21.4 as of the end of September, while Japanese stocks sported a CAPE ratio of 25.1. That was despite strong performances from both markets so far in 2025. The iShares Core MSCI Europe ETF (IEUR 0.29%) has returned over 30% so far this year. The Franklin FTSE Japan Hedged ETF (FLJH 0.12%) is up over 25%. The former benefited from strong gains in the euro relative to the U.S. dollar. The latter hedges the Japanese yen against the dollar to avoid the impact of foreign-exchange fluctuations on U.S. investors.

NYSEMKT: IEUR
Key Data Points
Despite both indexes outpacing the S&P 500 this year, they still trade at far less exuberant valuations. As a result, Shiller expects the European index to return an average of 8.2% annually over the next decade and the Japanese index to produce average annual total returns of 6.5%. Either of the above index funds could prove a smart way for U.S. investors to diversify their portfolios. And with their low expense ratios, the valuable international exposure they offer won't cost investors much.
Investors could also look to certain specific segments of the market that are less loftily valued, or to smaller stocks. Both the mid-cap S&P 400 and the small-cap S&P 600 are trading at far more attractive valuations than the S&P 500. That said, investors can find stocks of all sizes that currently carry attractive (or unattractive) valuations.
While Shiller cautions investors against overexposure to the big, expensive AI stocks in the market, there are still a lot of opportunities worth pursuing for investors. Keeping CAPE ratios in mind when making asset allocation and diversification choices can help you navigate the current environment and protect your portfolio from potential downside.