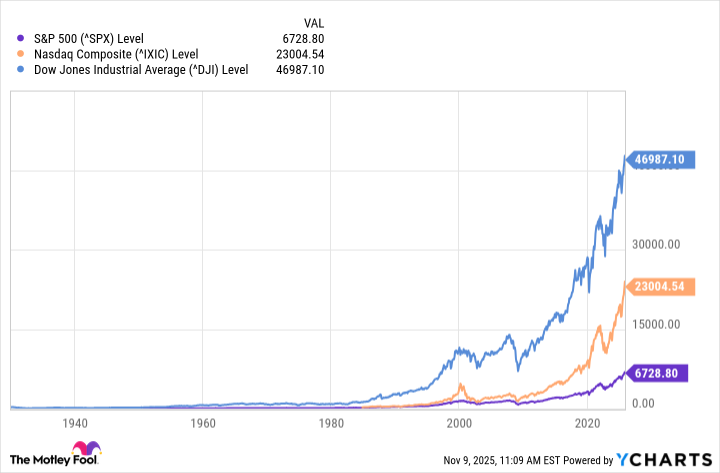
The S&P 500 (^GSPC 0.69%), Nasdaq Composite (^IXIC 1.21%), and Dow Jones Industrial Average (^DJI 0.18%) are trading at levels that hover right around all-time highs.
On the surface, seeing each major index continue to climb higher might suggest growing optimism from investors. But in the background, an important indicator known as the Fear & Greed Index is telling a much different story.
Let's break down the factors contributing to this divergence and what it means for investors right now.
What is the Fear & Greed Index and why does it matter?
CNN Business created the Fear & Greed Index as a barometer that quantifies investor sentiment in a single score. Readings between 0 and 40 indicate fear, while 60 through 100 lie on the greed side of the equation.
Some of the variables the Fear & Greed index take into consideration include moving averages across the S&P 500, bifurcating the number of stocks trading at 52-week highs and lows, volume levels on the New York Stock Exchange (NYSE), spreads between put and call options, analyzing activity in the CBOE Volatility Index (VIX), demand for junk bonds, and the variance between stock and bond market returns on a rolling 20 day basis.
As I write this, the Fear & Greed Index sports a reading of 21 -- signaling levels of "extreme fear."

Image source: Getty Images.
Why might investors be fearful right now?
It seems counterintuitive that the stock market is operating at all-time highs, and yet investors are extremely fearful. In my eyes, there are a number of factors at play contributing to this disparity.
First, the S&P 500 Shiller CAPE Ratio -- which is used by analysts as a proxy for whether the market is overvalued or undervalued -- currently sits around 40. This is eerily close to levels witnessed in the late 1990s, just prior to the bursting of the Dot-com bubble.
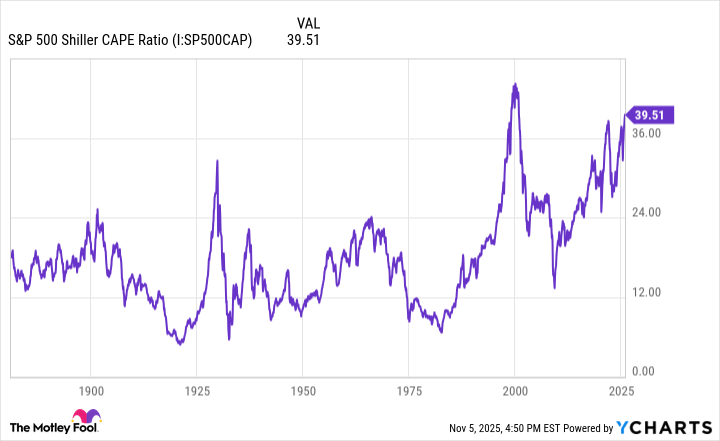
S&P 500 Shiller CAPE Ratio data by YCharts
When the Shiller CAPE ratio reaches peaks -- as it did during the 1920s and late 1990s -- stock market corrections tend to follow.
While AI is the biggest catalyst fueling the stock market, the other side to this story is that a growing number of investors are becoming concerned that the music is going to stop. In other words, people are beginning to ask the question: Is AI the next big bubble?
Against that backdrop, I'm not surprised that some investors think an AI bubble could ripple through the broader market and fuel an epic crash.
Besides the AI rally, the stock market could be due for a pullback sooner than later anyway. From a macro standpoint, the calendar year is almost over -- a period which often comes with outsized volatility.
During the final months of the year, investors may choose to offset their capital gains liability by selling laggards in their portfolio. This is a strategy known as tax loss harvesting. Seasonal dynamics like this can lead to sharp declines across the broader market, even in the middle of an otherwise bullish environment.
Is now a good time to buy or sell stocks?
Consistently and accurately predicting the direction of an individual stock is virtually impossible. However, based on the financial trends explored throughout this article, it's reasonable to say the broader stock market rises in value over time. While economic cycles will vary, history shows that the market is a resilient machine.
With these themes in mind, a contrarian response to the current fearful sentiment would be to buy the dip in the event of a stock market sell-off.
The logic here is straightforward: Even when the S&P 500 is at all-time highs, the index is far more likely to move higher decades from now than it is where it sits today -- making now an interesting time to capitalize on the fearful dynamics permeating through the market.