Inflation continues to be an issue for the Federal Reserve, so much so that the Federal Open Market Committee (FOMC) just raised the federal funds rate for the first time in three years.
In August, inflation clocked in 3.4% higher year over year on a seasonally adjusted basis, according to the Consumer Price Index (CPI). Excluding more volatile food and energy prices, core CPI rose 2.4%.
That's not where the Fed would like it, but it's a far cry from when the CPI surpassed 9% in 2022, marking the highest inflation in 40 years. While inflation has made progress, it has not shown clear progress toward the Fed's 2% target this year.
And in July, the U.S. M2 money supply grew at the fastest level seen in three years. It could be an ominous sign for inflation.

Image source: Getty Images.
What is the M2 money supply, and what does it have to do with inflation?
There are M1 and M2 money supplies. M1 is cash in circulation and money that can very easily be converted to cash, such as funds in a checking or savings account.
M2 money supply is M1 plus time deposits of less than $100,000 and money market funds, so now we're talking about funds in banks earning higher interest rates, driven by prevailing market rates.
Some economists view the money supply as a leading indicator of inflation because if there's more money circulating in the system, there's more money available to be spent, driving demand and, therefore, prices.
As you can see in the chart, the money supply has expanded tremendously since the turn of the century. This has been driven by economic growth, quantitative easing by the Federal Reserve during financial crises, low interest rates, and deficit spending by the U.S. government.
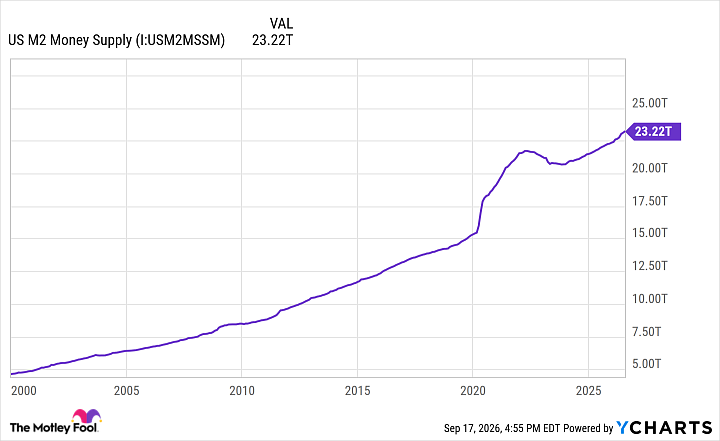
US M2 Money Supply data by YCharts
In July of this year, the most recent month for which data is available, the M2 money supply grew roughly 5.4% year over year. That's the fastest growth seen since June 2022, when inflation was raging.
What could explain the recent acceleration in M2 growth?
Regarding the M2 money supply, a few factors could be driving it higher.
The Fed ended quantitative tightening last December, during which it had been letting maturing bonds roll off its massive balance sheet without reinvesting the proceeds into new bonds. That had effectively been draining liquidity from the economy. Around the same time, the Fed once again effectively restarted QE and began buying bonds, pumping money into the economy.
This time, the Fed labeled its efforts reserve management purchases (RMP). The agency began doing RMPs because it noticed that liquidity in certain overnight funding markets that supply bank reserves had become too tight.
Another potential reason for the faster growth in M2 could be the large increase in asset and stock prices in recent years. While these are not included in M2 specifically, people could take profits and move them to accounts included in M2. There's also been growth in bank lending.
Is M2 a leading indicator of inflation?
As with most economic data points, there's considerable debate over whether an increase in M2 is directly indicative of inflation.
Both current Fed Chair Kevin Warsh and former Fed Chair Jerome Powell have expressed differing views over the years. Five years ago, Powell, according to Barron's, told Congress that M2 "doesn't really have important implications for the economic outlook."
Powell added, "The classic relationship no longer holds...It's something we have to unlearn."
However, during a semiannual monetary policy announcement in July, Warsh mentioned the M2 as a way to "measure the stock of money." In a hearing before Congress regarding this report, Warsh added that had the Fed paid closer attention to M2 supply during the pandemic, the agency might have seen the high inflation coming.
Between May 2020 and March 2021, the M2 money supply grew at least 20% annually each month, reaching nearly 27% one month during that window.
"I do not show up here as a monetarist. I do not show up and say the secret to inflation is, if we only knew M2, everything would be swell," Warsh said, according to Reuters. "My view is that a modern central banker should have a mosaic of information... "
So, it's clear that the extent to which M2 directly indicates inflation is debatable. It's also worth noting that inflation is more supply-side driven right now due to higher oil prices.
But I would agree with Warsh that one data point will never tell the whole story, especially when you consider everything that has happened in recent years. Investors need to do their best to monitor a multitude of data points as they try to figure out which direction inflation is headed.