The real-money Inflation-Protected Income Growth portfolio attempts to invest in companies that trade at reasonable valuations with healthy balance sheets and well covered and growing dividends. The portfolio aims to generate an income stream that grows at least as fast as inflation over time.
That's not exactly a strategy designed to set the investing world on fire, but the portfolio is holding its own. With a nice rise since last week's update, its 23.6% total return since its December 2012 inception is slightly ahead of a strategy of investing in the S&P 500 tracking SPDRs and reinvesting dividends. The good news from that is that the portfolio is doing well. The bad news is that it means that a few of the portfolio picks are approaching the point where they just might need to be sold.
Who may be on the auction block and why?
J.M. Smucker (SJM +2.31%) is the iconic maker of its namesake jams and jellies, as well as a whole host of other foods and beverages, including Jif peanut butter and Folger's coffee. It's a great company with an awesome heritage and solid prospects for the long run, but its substantial rise since its original selection puts it ahead of my fair-value estimate. Unless upcoming signs point to faster growth to justify its higher price, it's a candidate to be sold if its stock rises past $120.
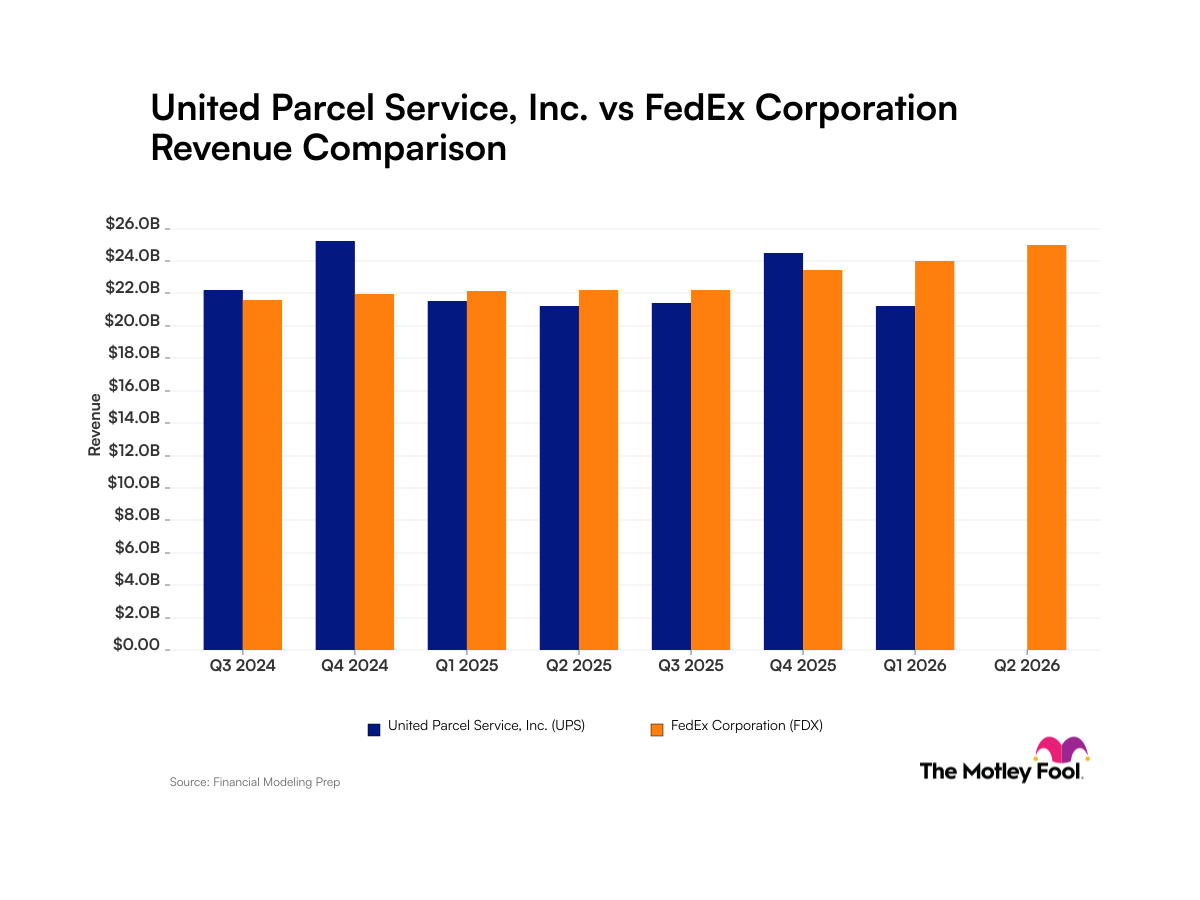
UPS (UPS -1.73%) is the company behind those ubiquitous brown delivery trucks and the incredibly catchy "we love logistics" commercials. The company's business remains solid, but it is economically sensitive and guided down expectations earlier this year in part on a weak economic outlook. Add to that weak outlook a balance sheet that lost equity because of a substantial charge to fund its pension plan, and the company's valuation looks a bit stretched alongside heavier leverage than I'd like to see.
UPS the business still looks solid, and I love logistics almost as much as UPS does, but as an investment, it's a candidate to be sold if its stock rises past $100. Of course, if the company shows signs of faster growth or otherwise deleverages its balance sheet, that decision can still be reversed.
And finally there's NV Energy (NYSE: NVE). The Nevada electric generator is on track to be bought out by Warren Buffett's Berkshire Hathaway (NYSE: BRK-A)(NYSE: BRK-B) for $23.75 per share in cash. Thanks to that buyout offer, NV Energy's shares have already risen to about that level. Still, with another quarter of dividends expected and the ability to capture long-term capital-gains tax treatment by waiting until January, the IPIG portfolio expects to hold on just a little bit longer before selling.
Although Buffett is an awesome capital allocator and his Berkshire Hathaway has been a tremendous long-term investment, Berkshire Hathaway's stock is not currently a candidate for the IPIG portfolio. The key reason is that Berkshire Hathaway doesn't pay a dividend, and this portfolio is focused on companies that do.
How is the IPIG portfolio doing?
The following table shows a snapshot of how that portfolio has performed, along with the picks within it. Sure, it's a motley collection of stocks that span several industries, but they all met those key dividend, balance sheet, and valuation criteria when purchased. As you can see from the table, it's a combination that has worked well.
|
Company Name |
Purchase Date |
Total Investment (Including Commissions) |
Current Value |
Current Yield |
|---|---|---|---|---|
|
United Technologies |
Dec. 10, 2012 |
$1,464.82 |
$1,926.18 |
2.20% |
|
Teva Pharmaceutical |
Dec. 12, 2012 |
$1,519.40 |
$1,559.52 |
2.93% |
|
J.M. Smucker |
Dec. 13, 2012 |
$1,483.45 |
$1,812.20 |
2.18% |
|
Genuine Parts |
Dec. 21, 2012 |
$1,476.47 |
$1,854.03 |
2.67% |
|
Mine Safety Appliances |
Dec. 21, 2012 |
$1,504.96 |
$1,880.64 |
2.30% |
|
Microsoft |
Dec. 26, 2012 |
$1,499.15 |
$1,877.15 |
3.28% |
|
Hasbro |
Dec. 28, 2012 |
$1,520.60 |
$2,008.96 |
3.42% |
|
NV Energy |
Dec. 31, 2012 |
$1,504.72 |
$1,992.48 |
3.20% |
|
UPS |
Jan. 2, 2013 |
$1,524.00 |
$1,815.40 |
2.73% |
|
Walgreen |
Jan. 4, 2013 |
$1,501.80 |
$2,238.40 |
2.25% |
|
Texas Instruments |
Jan. 7, 2013 |
$1,515.70 |
$1,897.86 |
2.97% |
|
Union Pacific |
Jan. 22, 2013 |
$805.42 |
$944.22 |
2.01% |
|
CSX |
Jan. 22, 2013 |
$712.50 |
$878.22 |
2.32% |
|
McDonald's |
Jan. 24, 2013 |
$1,499.64 |
$1,515.84 |
3.42% |
|
Becton, Dickinson |
Jan. 31, 2013 |
$1,518.64 |
$1,850.58 |
1.93% |
|
AFLAC |
Feb. 5, 2013 |
$1,466.35 |
$1,740.96 |
2.17% |
|
Air Products & Chemicals |
Feb. 11, 2013 |
$1,510.99 |
$1,848.24 |
2.61% |
|
Raytheon |
Feb. 22, 2013 |
$1,473.91 |
$2,058.21 |
2.89% |
|
Emerson Electric |
April 3, 2013 |
$1,548.12 |
$1,829.80 |
2.51% |
|
Wells Fargo |
May 30, 2013 |
$1,525.48 |
$1,532.91 |
2.90% |
|
Kinder Morgan |
June 21, 2013 |
$1,518.37 |
$1,490.58 |
4.51% |
|
Cash |
$514.85 | |||
|
Total Portfolio |
$37,067.23 |
Data from the IPIG portfolio's brokerage account, as of Oct. 11, 2013.
To follow the iPIG portfolio as buy and sell decisions are made, watch Chuck's article feed by clicking here. To join The Motley Fool's free discussion board dedicated to the iPIG portfolio, simply click here.