Dividend stocks are shares of publicly traded companies that regularly return a portion of their profits to shareholders, most often through quarterly cash payments.
For many investors, dividend stocks offer an appealing balance: steady income today and the potential for long-term growth. Historically, dividend-paying companies have also shown lower volatility than the broader market, making them popular with income-focused and risk-conscious investors.
That said, not all dividend stocks are created equal. Understanding how dividends work and how to evaluate them is essential before investing.

Companies pay dividends to make owning their stock more enticing and to reward shareholders. Dividends are a method for returning profits directly to shareholders, and the distribution of regular payouts is usually a sign that the company is generating enough cash flow to comfortably afford to distribute some of its profits to its shareholders.
If a company is profitable but still focused on rapidly expanding its operational footprint and sales, paying dividends may not be a sensible move, because the capital used to fund distributions could be better allocated to initiatives that can grow its revenue. Alternatively, companies that have reached more mature growth and profit stages may decide they have sufficient cash flows and capital bases to support both optimal growth strategies and dividend payments to shareholders.
When a company can afford to pay dividends and increase its payout regularly, this can make its stock more attractive to own and raise its share price.
How dividend stocks work
When you own a dividend-paying stock, you can earn returns in two ways: dividend income and share-price appreciation.
Let's say you buy 100 shares of a company at $10 each -- you’ve invested $1,000. If the company pays an annual dividend of $0.50 per share, you’ll receive $50 in dividend income over the year: a 5% dividend yield.
What you do with those dividends is up to you. You can:
- Automatically reinvest them to buy more shares of the company through a dividend reinvestment plan (DRIP).
- Buy stock in a different company.
- Save the cash.
- Spend the money.
As long as the company continues paying its dividend, you’ll receive those payments regardless of short-term price fluctuations. That predictable income is a core reason investors choose dividend stocks.
While no dividend is guaranteed, a well-diversified portfolio of top dividend-paying companies can generate steady income across different market conditions and boost total returns over time.
Why investors choose dividend stocks
Like every other category of stocks, dividend stocks have risks and opportunities. Here are some notable examples.
Pros:
- Often profitable, established businesses
- Predictable income stream
- Historically lower volatility than non-dividend stocks
- Strong long-term total return potential
Cons:
- High yields can signal risk
- Overpaying for “safe” dividend stocks can limit returns
- Dividends can be cut during business downturns
- Dividends are usually taxable in non-retirement accounts
Key dividend metrics investors should know
Before you buy dividend stocks, it's important to know how to evaluate them. These metrics can help you understand how much in dividends to expect, how reliable a dividend might be, and -- most importantly -- how to identify red flags.
Dividend yield
Dividend yield shows the annual dividend as a percentage of the stock price. A $1 annual dividend on a $20 stock yields 5%.
Yield is most useful when compared to a company’s own history or peers. An unusually high yield can be a warning sign rather than a bargain.
Dividend payout ratio
The dividend payout ratio measures how much of a company’s earnings are paid out as dividends. A lower payout ratio generally indicates a more sustainable dividend and leaves room for growth.
Cash dividend payout ratio
The cash payout ratio shows how much of a company’s free cash flow is distributed as dividends. Free cash flow is the cash left over after a business covers its operating costs and capital spending.
Because dividends are paid in cash, not accounting profits, this ratio is often a better indicator of dividend safety than earnings alone. A lower cash payout ratio means the company has more room to fund its dividend, invest in growth, and weather downturns. A high ratio can signal that the dividend may be harder to sustain.
Earnings per share (EPS) growth
Earnings per share (EPS) growth measures how much a company’s profit per share increases over time. It reflects a company’s ability to grow its underlying business.
Companies with consistent EPS growth are more likely to maintain and raise dividends, since growing profits provide the fuel for higher payouts. Over the long run, dividend growth almost always follows earnings growth, making EPS growth a key signal of dividend quality.
Total return
Total return combines dividends and share-price gains. A stock that pays a 3% dividend and grows 7% annually delivers a 10% total return.
Why high yield isn't everything
Many new investors are drawn to the highest dividend yields, and that’s often a mistake.
A rising yield can result from a falling stock price, signaling that investors expect the dividend to be cut. This is known as a dividend yield trap.
Here are some steps you can take to avoid falling for a yield trap:
- Don’t buy stocks based on yield alone.
- Check payout ratios and free cash flow.
- Look for a history of dividend growth.
- Review the balance sheet and debt levels.
- Understand the company’s business risks.
Sadly, a yield that looks too good to be true often is. It's better to buy a dividend stock with a rock-solid lower yield than to chase a high yield that may prove illusory.
Focusing on dividend growth -- a company's history and ability to raise its dividend -- often proves more profitable.
Examples of dividend stocks
Here are some well-known companies with a long history of paying dividends, along with their dividend yields at recent stock prices and the per-share amount of each dividend:
Company | Industry | Dividend Yield | Quarterly Dividend Amount |
|---|---|---|---|
Chevron (NYSE:CVX) | Energy | 3.4% | $1.78 |
Procter & Gamble (NYSE:PG) | Consumer defensive | 2.9% | $1.057 |
Lowe's (NYSE:LOW) | Consumer cyclical | 2% | $1.20 |
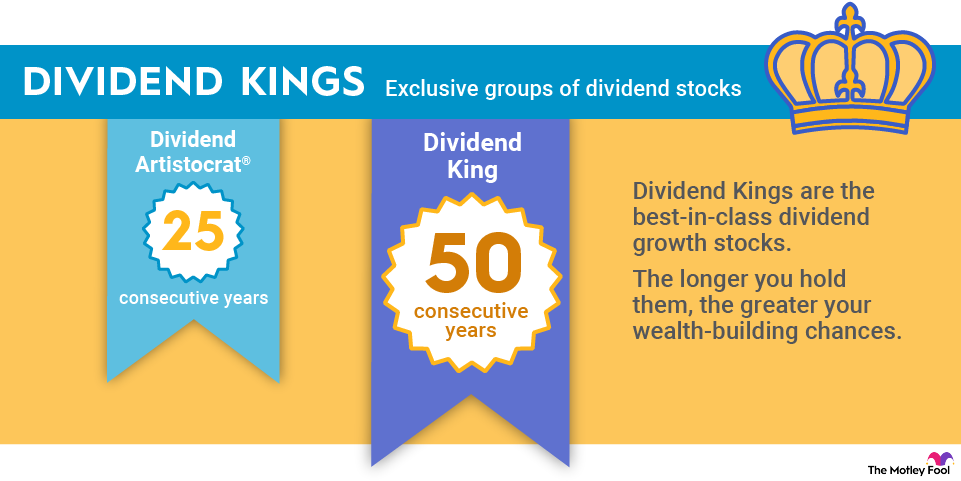
Both Procter & Gamble and Lowe's have raised their dividends for more than 50 consecutive years, earning them “Dividend King” status and placing them among the Dividend Achievers tracked by Nasdaq.
Chevron, meanwhile, has increased its dividend for 38 straight years. Together, these examples highlight an important point: Dividend stocks span many industries, and yields can vary widely by company and sector.
Dividend investment strategies
Common strategies include:
- Dividend growth investing: Focus on companies with a track record of raising dividends consistently.
- Dividend ETFs: Gain diversified exposure through funds that hold baskets of dividend-paying stocks.
- Dividend reinvestment (DRIP): Automatically reinvest dividends to compound returns over time.
No strategy eliminates risk, but prioritizing financial strength and dividend growth can reduce the odds of unpleasant surprises.
How to buy dividend stocks
- Open your brokerage app: Log in to your brokerage account where you handle your investments. If you don't have one yet, take a look at our favorite brokers and trading platforms to find the right one for you.
- Search for the stock: Enter the ticker or company name into the search bar to bring up the stock's trading page.
- Decide how many shares to buy: Consider your investment goals and how much of your portfolio you want to allocate to this stock.
- Select order type: Choose between a market order to buy at the current price or a limit order to specify the maximum price you're willing to pay.
- Submit your order: Confirm the details and submit your buy order.
- Review your purchase: Check your portfolio to ensure your order was filled as expected and adjust your investment strategy accordingly.
Dividend stocks vs. dividend funds
Dividend stocks are the stocks of individual companies that regularly return cash to shareholders through direct cash distributions. Meanwhile, dividend funds are equities that bundle holdings in multiple dividend-paying stocks into a single tradeable security. Some dividend-focused funds may include holdings other than dividend stocks.
- Dividend funds will typically be either exchange-traded funds (ETFs) or mutual funds.
- ETFs and mutual funds offer diversification and protection from the risks of downside volatility associated with owning individual stocks by combining a large number of equities into a single security.
- An investor could spend $100 on a single hypothetical dividend stock or on a share of a hypothetical dividend fund that would give them smaller positions across 40 different dividend stocks packaged together.
- Dividend funds are typically safer and more reliable than individual dividend stocks, but they often carry management fees.
- Some dividend funds will also include holdings in bonds, money markets, and other fixed-income investments.
How are dividends taxed?
Most dividends are considered qualified dividends and are taxed at 0%, 15%, or 20% in taxable accounts, depending on your income. Some dividends, including those from real estate investment trusts (REITs) and master limited partnerships (MLPs), may be taxed at higher ordinary income rates.
Dividends held in tax-advantaged accounts, such as individual retirement accounts (IRAs), are generally exempt from current taxes, with limited exceptions.
The bottom line
Dividend stocks can provide steady income, lower volatility, and strong long-term returns, but only if you choose them carefully.
Rather than chasing the highest yield, focus on companies with durable businesses, healthy cash flows, and a proven ability to grow dividends over time. When used thoughtfully, dividend stocks can be a powerful tool for building wealth and financial stability.
Related investing topics
FAQ
Dividend stocks FAQ
About the Author

Keith Noonan has no position in any of the stocks mentioned. The Motley Fool has positions in and recommends Chevron. The Motley Fool recommends Lowe's Companies. The Motley Fool has a disclosure policy.