On May 30, Williams-Sonoma (NYSE:WSM) released first-quarter earnings for the period ended April 29.
- Sales rose 2.7%, retail revenues increased 4.5%, direct-to-customer sales increased 0.6%, and same-store sales fell by 0.8%.
- Because of increased markdowns and cost of merchandise sold in the Pottery Barn & Pottery Barn Kids brands, gross margins declined by 150 basis points.
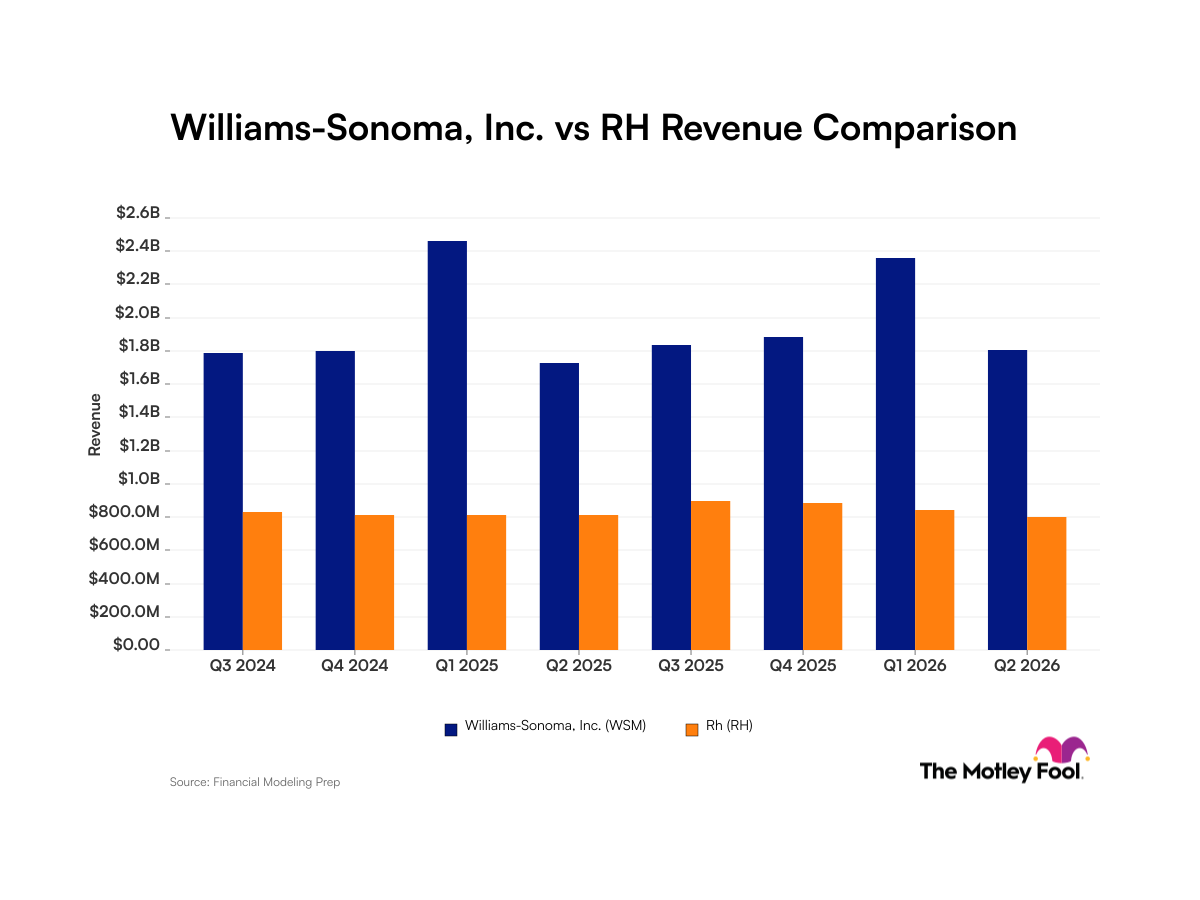
- For the second quarter, management projects revenue to be in the range of $855 million to $873 million, and EPS between $0.14 to $0.18 per share.
(Figures in millions, except per-share data.)
Income Statement Highlights
|
Q1 2007 |
Q1 2006 |
Change | |
|---|---|---|---|
|
Sales |
$816.1 |
$794.3 |
2.7% |
|
Net Profit |
$18.2 |
$23.1 |
(21.4%) |
|
EPS |
$0.16 |
$0.20 |
(20.0%) |
|
Diluted Shares |
112.4 |
117.7 |
(4.6%) |
Get back to basics with the income statement.
Margin Checkup
|
Q1 2007 |
Q1 2006 |
Change* | |
|---|---|---|---|
|
Gross Margin |
37.0% |
38.5% |
(1.5) |
|
Operating Margin |
3.5% |
4.4% |
(0.9) |
|
Net Margin |
2.2% |
2.9% |
(0.7) |
Margins are the earnings engine.
Balance Sheet Highlights
|
Assets |
Q1 2007 |
Q1 2006 |
Change |
|---|---|---|---|
|
Cash + ST Invest. |
$117.4 |
$250.5 |
(53.1%) |
|
Accounts Rec. |
$43.6 |
$58.9 |
(26.0%) |
|
Inventory |
$639.4 |
$547.6 |
16.8% |
|
Liabilities |
Q1 2007 |
Q1 2006 |
Change |
|---|---|---|---|
|
Accounts Payable |
$156.1 |
$185.0 |
(15.6%) |
|
Long-Term Debt |
$12.8 |
$14.4 |
(10.9%) |
The balance sheet reflects the company's health.
Cash Flow Highlights
|
Q1 2007 |
Q1 2006 |
Change | |
|---|---|---|---|
|
Cash From Ops. |
($124.7) |
($77.6) |
N/A |
|
Capital Expenditures |
$31.9 |
$39.0 |
(18.3%) |
|
Free Cash Flow |
($156.6) |
($116.6) |
N/A |
Free cash flow is a Fool's best friend.
Related Foolishness:
Fool by Numbers is designed to give you the raw earnings information in a timely fashion, putting all the numbers you need in one easy-to-read place. But at The Motley Fool, we believe numbers tell only part of the story, so check Fool.com for more of our in-depth discussion of what the numbers mean. This data has been provided by Netscribes. To provide feedback on this article, please click on the "feedback" button below.