There's no foolproof way to know the future for Yamana Gold (NYSE: AUY) or any other company. However, certain clues may help you see potential stumbles before they happen -- and before your stock craters as a result. Rest assured: Even if you're not monitoring these metrics, short-sellers are.
A cloudy crystal ball
I often use accounts receivable (AR) and days sales outstanding (DSO) to judge a company's current health and future prospects. It's an important step in separating the pretenders from the market's best stocks. Alone, AR -- the amount of money owed the company -- and DSO -- days worth of sales owed to the company -- don't tell you much. However, by considering the trends in AR and DSO, you can sometimes get a window onto the future.
AR that grows more quickly than revenue, or ballooning DSO, can suggest a desperate company that's trying to boost sales by giving its customers overly generous payment terms. Alternately, it can indicate that the company sprinted to book a load of sales at the end of the quarter, like used-car dealers on the 29th of the month. (Sometimes, companies do both.)
Why might an upstanding firm like Yamana Gold do this? For the same reason any other company might: to make the numbers. Investors don't like revenue shortfalls, and employees don't like reporting them to their superiors.
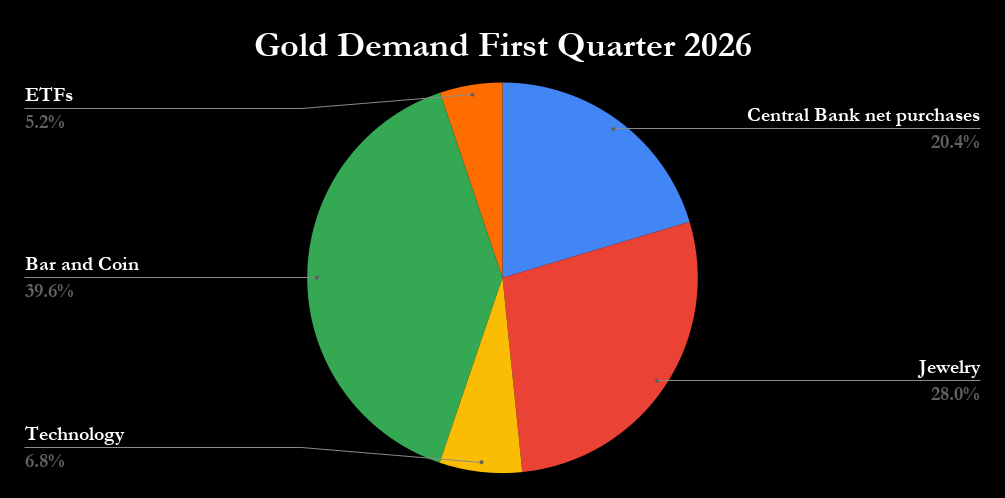
Is Yamana Gold sending any warning signs? Take a look at the chart below, which plots revenue growth against AR growth, and DSO:

Source: Capital IQ, a division of Standard & Poor's. Data is current as of last fully-reported fiscal quarter. FQ = fiscal quarter.
The standard way to calculated DSO uses average accounts receivable. I prefer to look at end-of-quarter (EOQ) receivables, but I've plotted both above.
Watching the trends
When that red line (AR growth) crosses above the green line (revenue growth), I know I need to consult the filings. Similarly, a spike in the blue bars (DSO) indicates a trend worth worrying about. As another reality check, it's reasonable to consider what a normal DSO figure might look like in this space.
|
Company |
LFQ Revenue |
DSO |
|---|---|---|
|
Yamana Gold |
$351 |
23 |
|
Barrick Gold (NYSE: ABX) |
$2,642 |
9 |
|
Kinross Gold (NYSE: KGC) |
$697 |
22 |
|
Newmont Mining (NYSE: NEM) |
$2,153 |
23 |
Source: Capital IQ, a division of Standard & Poor's. DSO calculated from average AR. Data is current as of last fully-reported fiscal quarter. LFQ = last fiscal quarter. Dollar figures in millions.
Differences in business models can generate variations in DSO, so don't consider this the final word -- just a way to add some context to the numbers. But let's get back to our original question: Will Yamana Gold miss its numbers in the next quarter or two?
The numbers don't paint a clear picture. For the last fully reported fiscal quarter, Yamana Gold's year-over-year revenue grew 48.4%, and its AR grew 39.2%. That looks OK. End-of-quarter DSO decreased 6.2% from the prior-year quarter. It was up 32.3% versus the prior quarter. That demands a good explanation. Still, I'm no fortune-teller, and these are just numbers. Investors putting their money on the line always need to dig into the filings for the root causes and draw their own conclusions.
What now?
I use this kind of analysis to figure out which investments I need to watch more closely as I hunt the market's best returns. However, some investors actively seek out companies on the wrong side of AR trends in order to sell them short, profiting when they eventually fall. Which way would you play this one? Let us know in the comments below.