This article is part of our Rising Star Portfolios series. Sean is co-manager of the Dada Portfolio.
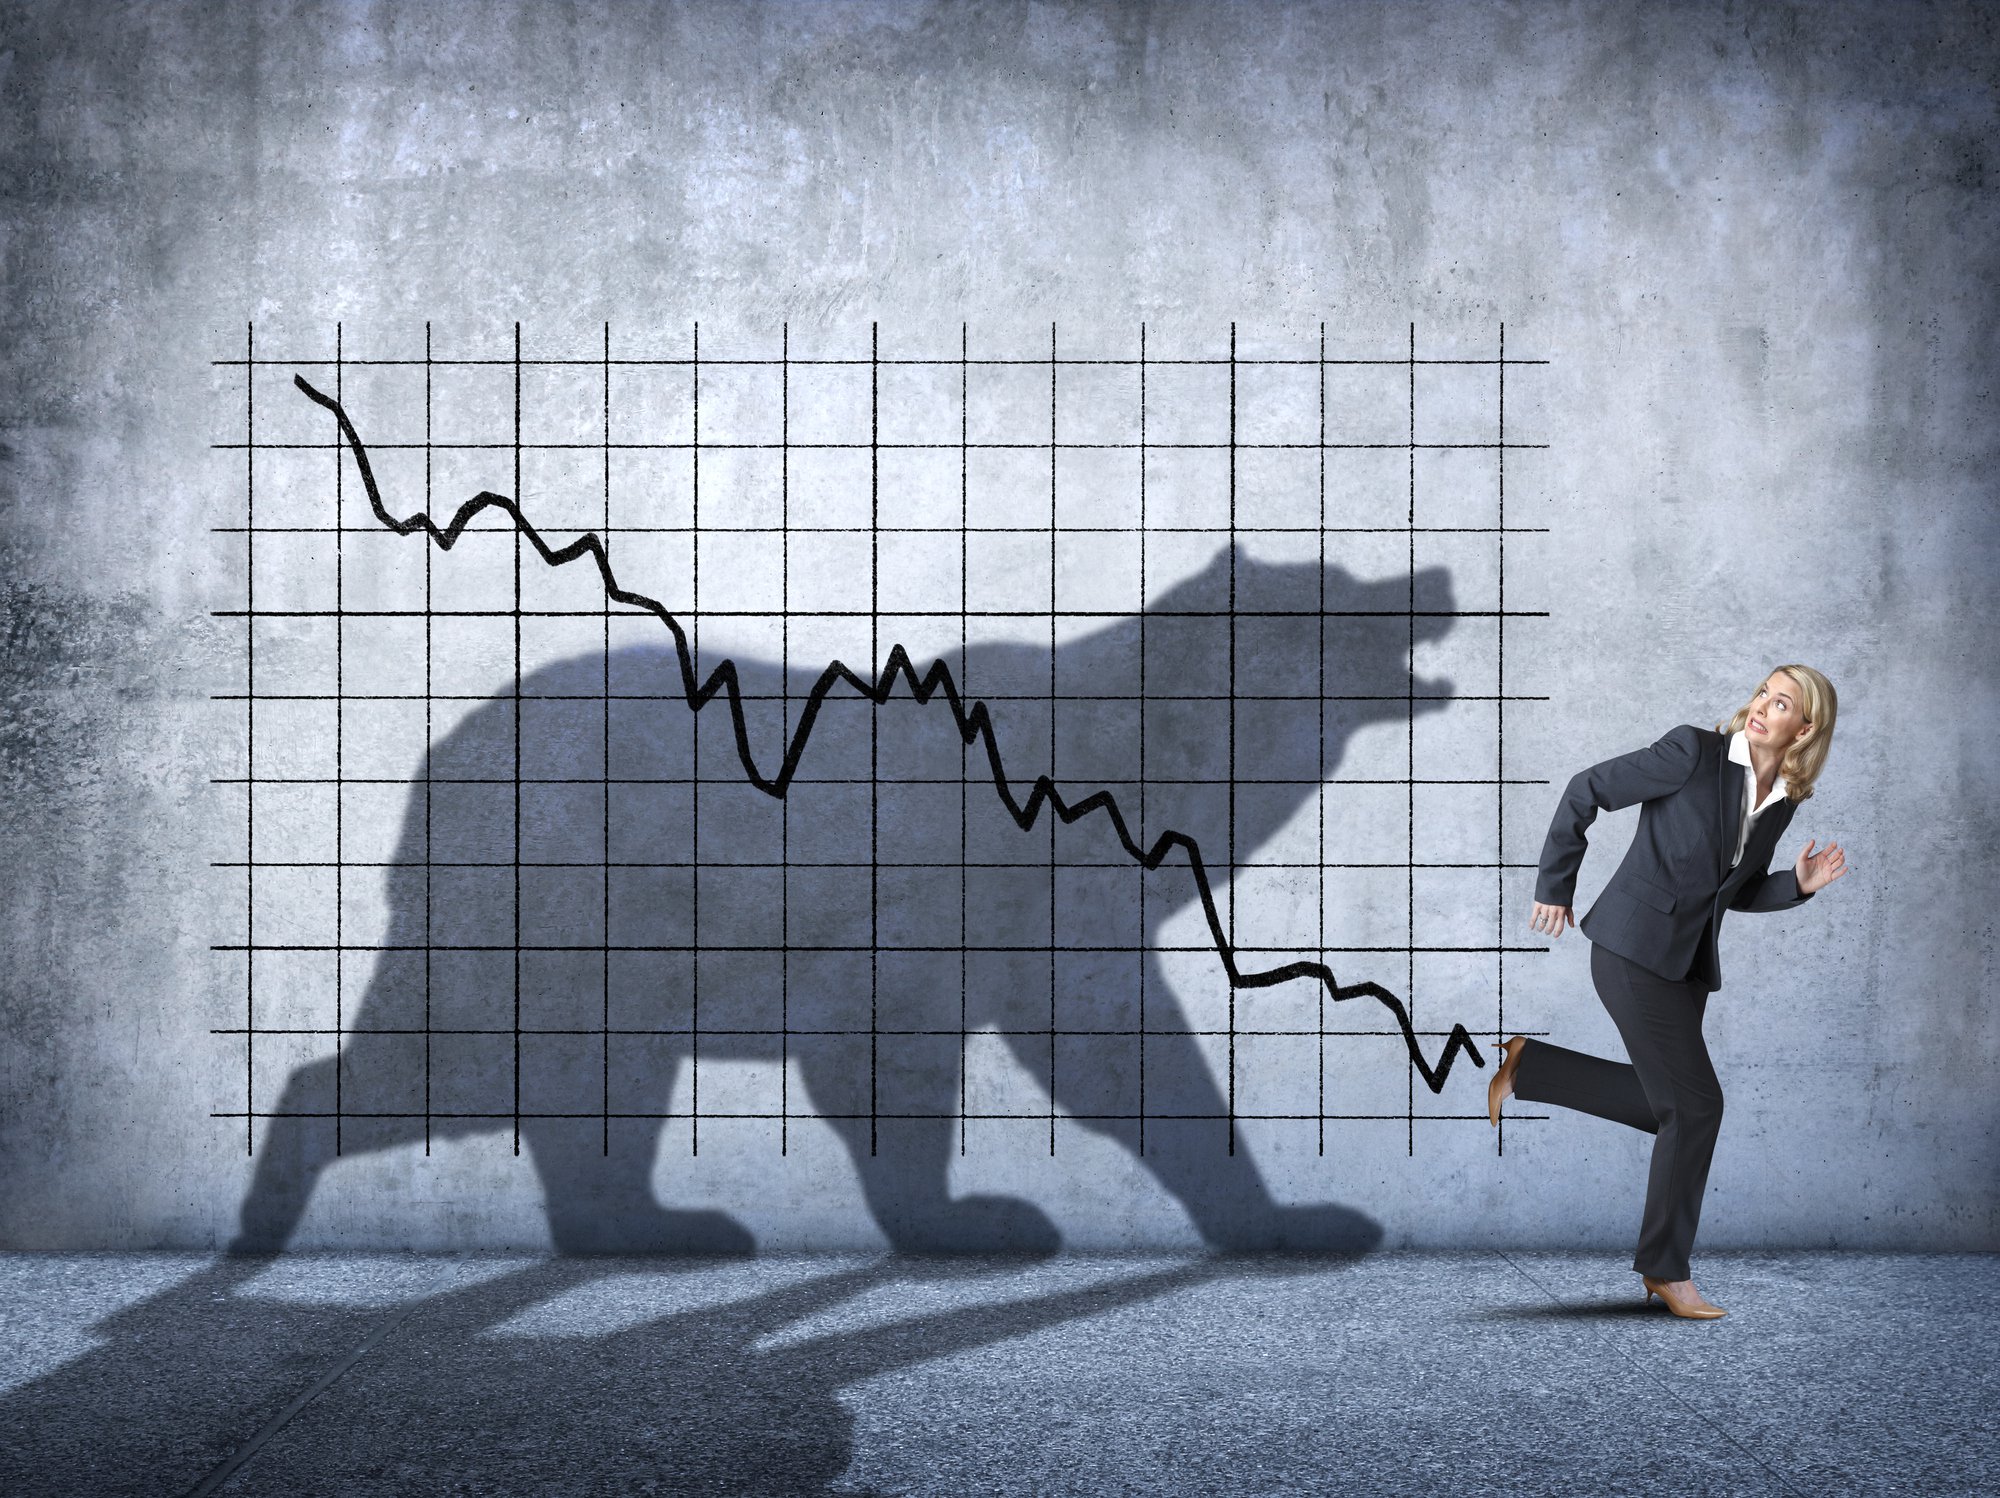
The recession officially ended -- a year and a half ago. What? That doesn't sound right, does it?
Unemployment is still at 9% and underemployment, a measure that includes part-time workers who are looking but unable to find full-time work, is at 18%. Yet I feel confident that we're at a turning point and now's the perfect time to start looking at the American consumer again.
Let's look at a few facts.
Nordstrom (NYSE: JWN) reported same-store sales growth of 5.8% this past quarter. Saks (NYSE: SKS) recorded comparable-store sales growth of 5.7%. Tiffany & Co. (NYSE: TIF) saw a 14% worldwide net increase in revenue. I mean, Chipotle (NYSE: CMG) saw comps increase by 11.4%! Recession what?
Premise 1: Unemployment fears are (a little bit) overblown
Using unemployment statistics as a proxy for the overall well-being of the American consumer seems to be a common practice.

Source: U.S. Bureau of Economic Analysis and U.S. Bureau of Labor Statistics.
But looking at the historical data doesn't suggest a startling correlation one way or the other. Personal consumption increased in the '60s while unemployment was low; that makes sense. But it also grew at an average of 4.4% per year during the early '80s when unemployment averaged almost 8%!
That doesn't seem to make any sense until one remembers that even at today's unemployment rate of 9%, there's still 91% of the population in an income-earning situation. Moreover, the top 80% of households in our nation have consistently owned 96% of the wealth.

Source: U.S. Census Bureau. In 1989 dollars.
In and of themselves, these aren't good things for our nation. The unemployment rate is too high and the distribution of wealth in this country isn't the most equitable. But, the scope of this article is not to recommend policy changes. I merely bring these statistics up to prove that, despite unacceptably high unemployment rates, the U.S. on the whole is still earning consumable income.
Premise 2: The average American is still hurting, but not in critical condition
This is why we had a housing bust:

Source: U.S. Bureau of Economic Analysis and Federal Reserve. In 1989 dollars. Per capita defined by total U.S. population.
But this is why we might be past the worst of it:

Source: U.S. Bureau of Economic Analysis and Federal Reserve.
Our consumer debt-to-incomes ratio has fallen below peak 2001-2007 levels, and even better, our savings rate is the highest it's been since 1998. Still, the current data aren't conclusive. The trends look good but trying to project the future by drawing out a straight line is obviously not going to work.
At the same time, extrapolating a "safe" debt to incomes ratio or "safe" savings rate by looking to the past also probably isn't going to work. We will probably never see savings rates as high as 20% again, but one thing that might be worth considering is that our economy has fundamentally and structurally changed so that it is able to support a higher, sustained level of debt to income and a lower, sustained savings rate. Obviously, not as low as we tried to push it to in the middle of this decade, but our financial system is more efficient, more liquid, more accessible (and lest we forget, more risky) than it ever was. We are arguably operating in a different financial system with an equilibrium savings rate that may not be that far off.
Premise 3: Consumer confidence low but rebounding
The Conference Board takes a monthly nationwide survey of 5,000 households to gauge consumer sentiment. The resulting product is the Consumer Confidence Index. Perhaps even more important than the aggregated index is its component parts: the Present Situation Index, which measures how respondents feel about the current economic situation, and the Expectations Index, which measures how they feel about the future:

Source: The Conference Board. 1985 = 100.
Not surprisingly, the Present Situation Index hit a nadir early in 2009 and hasn't really picked up since. What is surprising is how optimistic people have become about the future. Perhaps even more shocking is just how correlated the Expectations Index is with the stock market:

Source: The Conference Board and Capital IQ.
Look at where both the Expectations Index and the S&P 500 take off in March 2009. The market is up 61% from that nadir. It's hard to tell how causality flows between the two but there's certainly a little bit of George Soros' reflexivity here. As expectations get better, people invest more in the stock market and returns improve. As returns improve, people feel better about their portfolios and the security of their money and their expectations are vindicated and continue upward, and so on and so forth.
Conclusion: This is the right time to look at retail
As I said earlier, the data are inconclusive. But anytime there's a lack of certainty there's also an opportunity. My macro thesis is this: I think the retail sector is poised to come back big in the next year or two, but it's important to be selective. The average American is probably still not ready to throw her wallet on the table. She's shell-shocked, her confidence is still relatively low, and her perception of the economy continues to encourage her to stay on the sidelines. If we use Wal-Mart (NYSE: WMT) as a proxy for the average domestic shopper, we see that spending is down -1.3% on a comparable-store basis last quarter.
At the same time, overall, the fundamentals are changing and American consumers' savings are growing while they've been cutting down their debt load. They're sitting in the dugout now as opposed to being entirely out of the stadium like they were last year. Over the next year or two, I would expect confidence to continue rising and more people coming out to bat.
But even right now, there are some really juicy opportunities at the higher end. In the nearer term, it's that top 20% of income earners that is going to be crawling out of consumption hibernation first and that's where we're going to see the most action. Look at luxury retailers like Nordstrom, Saks, and Tiffany. Look at Apple (Nasdaq: AAPL), with its 67% revenue growth this quarter; 14 million iPhones and 4 million iPads sold from June to September? Are you kidding me? Who actually needs an iPad? And yet Americans spent over $7 billion on Apple products alone, in just the past three months!
So what I'm trying to say is this: Discretionary spending is alive, well, and ready to be picked at. I think this is the perfect time to make some contrarian picks and my Dada Portfolio has identified a few winners. Check out this article out to see what we're buying.