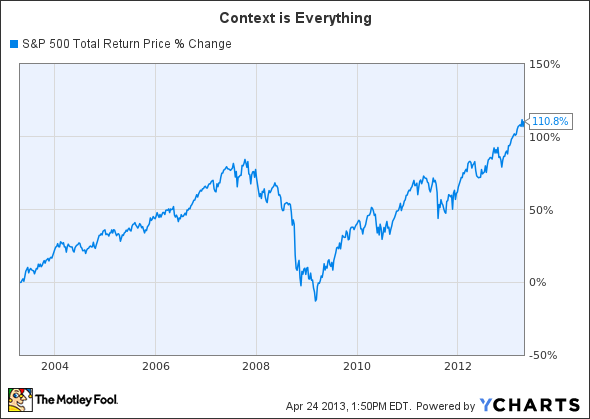
Journalists, myself included, will do a lot of things to grab attention to their headlines. Making doomsday, or overly pessimistic, is one of the most effective methods.
On Dec. 31, 2009, as unemployment was peaking and the stock market had just started its recovery, the Los Angeles Times ran the headline:
Stock market closes the books on a 'lost decade'
The article later states that "for many Americans who rode the market boom of the 1980s and 1990s -- and who came to trust the mantra of 'buy and hold' -- going 10 years with no capital gain to show for it is hard to swallow."
Take a look at the returns of the S&P 500, and it would be hard to argue.
Lies, big lies, and statistics
But when it comes to investing, context is everything. And there are three key concepts that need to be taken into consideration before deciding that the picture was as dark as some would have you believe.
First, dividends were completely discounted from the equation. Once companies get big enough that their markets are saturated, the main lure for investors is in the form of dividend payouts, not necessarily capital appreciation. Indeed, if we look at the effect dividends had in an investment in the S&P 500, one's losses are cut by about two-thirds.
The second error is that the "lost decade" assumed that investors only bought stocks on Jan. 1, 2000, and never added to them again at any point.
If you did that, and collected your dividends along the way, a $1,000 investment was worth about $918 10 years later. If, however, you continued regularly investing -- for the sake of this article, let's say $100 at the beginning of each year -- you would have ended the decade with $1,048. That's not a great return, but its certainly nice to make -- and not lose -- money.
But most importantly, you need to look at the values where people were buying in. Back in 2000, near the height of the dot-com boom, stocks were trading hands for ridiculous values. Take a look at the price-to-earnings ratio on the major indices around December 1999.
|
Index |
P/E |
|---|---|
|
S&P 500 (^SPX) |
29 |
|
Nasdaq (^IXIC) |
240 |
|
Dow Jones Industrial (^DJI) |
44 |
Sources: multpl.com, ameinfo.com, finance.zacks.com. Nasdaq did not include unprofitable offerings
When you consider that an accepted average for P/Es of major indices is about 15, people were simply buying into a stock market that was wildly overvalued.
When the dot-com bubble corrected, and the market hit a bottom in 2002 and 2003, the values were much more reasonable. Looking at it today, the past decade -- including dividends -- has treated investors much better.
What about today's market?
This leads us to probably the most pressing question for investors today: With the stock market hitting all-time highs, would it be wise to invest today?
Let's look at where our indices sit now.
|
Index |
P/E |
|---|---|
|
S&P 500 |
18 |
|
Nasdaq |
17 |
|
Dow Jones Industrial |
16 |
Source: The Wall Street Journal.
Though certainly not at 2000 levels, it seems that the stock market is sitting slightly above its 15 benchmark.
That doesn't mean you should shy away from stocks, especially if you research specific companies that don't exactly mimic the broader market. Just remember these three important lessons:
- Carefully consider the valuation of any stock or index that you buy.
- Reinvest those dividends
- Stick to a logical and regular investing schedule.


