
HomeDepot.com
Some investors see Home Depot (HD 1.32%) and Lowe's (LOW 0.32%) as risky investments these days. However, thanks to the 5 key charts below, not only can we gain key insights into each company's operatins but can also draw some key conclusions regarding each as a potential investment.
Free cash flow
Home Depot generates more free cash flow than Lowe's. This allows for more opportunities, including new store growth, store renovations, innovations, investments in new initiatives, and generous capital returns to shareholders.
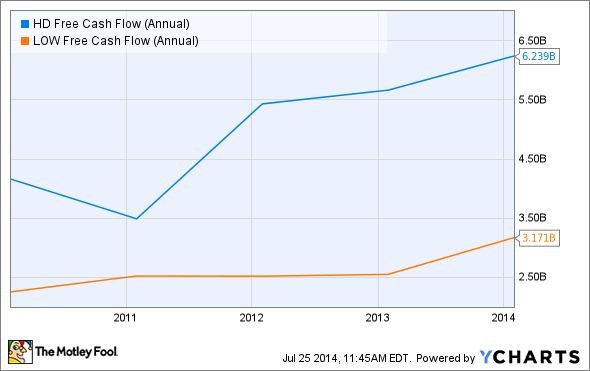
Home Depot Free Cash Flow (Annual) data by YCharts
Home Depot has also generated its free cash flow at a faster pace than Lowe's over the past five years: 50.01% vs. 40.62%. As usual, it's a tight race with Home Depot coming out on top. However, this is only one of the five key metrics.
Debt-to-equity ratio
When first glancing at the chart below, you will estimate that Home Depot is at more "risk" due to more debt accumulation than Lowe's. But there are two key points here. One, neither company is in dangerous territory. They both generate enough cash flow to pay off their debts. The second point will be below the chart:

Home Depot Debt-to-Equity Ratio (Annual) data by YCharts
Over this time frame, Home Depot's debt-to-equity ratio has increased 135.5%, whereas Lowe's debt-to-equity ratio has increased 233.2%. That said, debt isn't a concern for either company at the moment.
Revenue
Revenue can be tricky because it includes sales at new stores. However, a retailer isn't going to increase its store count unless it's confident in its future prospects. Therefore, while revenue can be misleading and overexcite investors at times, it's still an important metric. Since Home Depot is a much larger company, we'll take a look at revenue growth over the past five years:

Home Depot Revenue (Annual) data by YCharts
Once again, Home Depot is more impressive. Perhaps Lowe's has outperformed Home Depot for the more-important metric of net income over the past five years?
Net income
Home Depot has outperformed Lowe's in this key metric as well, thanks to supply chain optimization, effective cost-cutting measures, and better overall operations:

Home Depot Net Income (Annual) data by YCharts
Just keep in mind that Lowe's is far from a loser. It's actually a very well run company that's likely to have a bright future. If Lowe's were being compared to most big-box retailers -- as opposed to Home Depot -- it would look impressive. Now, let's take a look at that last key metric -- arguably the most important one of all for investors.
Return on invested capital
Home Depot wins again, demonstrating a superior return on invested capital (indicates top-tier efficiency) over the past five years:

Home Depot Return on Invested Capital (Annual) data by YCharts
Better yet, Home Depot expects its ROIC to improve to 24% for the fiscal year.
The bottom line
Home Depot is clearly a better investment at this point in time. The one edge (and it's a big one) that Lowe's has for the future is that it's MyLowe's loyalty program has a better chance of capturing the all-important millennials generation. This could lead to significant changes for the key metrics above in the future, but this isn't a guarantee; Home Depot can implement an initiative of its own to capture this increasingly important segment of the population. And as of right now, Home Depot is the clear leader in the home- improvement space.


