
Chart Industries, (GTLS 0.16%) has seen its stock price fall from more than $130 two years ago to below $17:

It's been a hard, painful journey for shareholders who bought at or near the peak, when the market was at its most exuberant about the potential for natural gas -- particularly exports of cheap American gas to foreign markets with huge (and growing) demand for energy. Needless to say, the thesis for Chart hasn't exactly played out, with weakness in potential growth markets like China, and a major slowing in capital projects by major oil and gas companies around the world.
Chart reported third-quarter financial results on October 29. Let's take a closer look at the details.
The numbers
| Q3 2015 | Q3 2014 | Change | |
| Revenue | $264MM | $293.8MM | -10% |
| Net income | $4.8MM | $22.9MM | -79% |
| EPS | $0.15 | $0.74 | -80% |
This marked the third-consecutive quarter of sales declines for Chart, setting the company up for an almost guaranteed drop in sales for the full fiscal year. Even with a tough 2014, Chart had grown annual sales every year for at least the past five.
What happened in the quarter
Chart management has taken steps in the past year and more to change its cost structure, including reducing headcount, and closing a manufacturing facility in Minnesota earlier this year. The company continues to feel the impact of that decision, as well as the 16% reduction in headcount during the past year.
- Drop in earnings partly due to $4.9 million in severance, and facility shutdown costs recorded in Q3.
- Gross margin fell to 25.9% from 31% in the year-ago period. This was also a decline from the 28.6% gross margin over the first half of 2015.
- Order backlog was $416.6 million at the end of the quarter, down 21% sequentially. A major part of this reduction was the removal of $93 million in distribution and storage (D&S) orders received prior to the quarter. Chart said the customers did not cancel the orders, but the company clearly doesn't see them filling anytime soon.
- Sales by segment were as follows: 21% decline in energy and chemicals, 7.6% decline in D&S, 2.2% increase in biomedical sales. Gross margins declined in all three segments.
What management said
Chairman and CEO Sam Thomas said the following about ongoing cost-control efforts:
Since we began our cost-cutting efforts in the fourth quarter of 2014, our headcount reduction now stands at 16% of our global workforce. We have action plans in place to continue to rationalize costs in our business as market conditions warrant into late 2015 and 2016.
About the potential beyond LNG:
Recently, we experienced increased demand for liquid hydrogen equipment, as industrial gas customers ramp up their hydrogen infrastructure to support hydrogen fuel cell powered lift trucks at North American warehouses and distribution centers.
Biomedical opportunity in emerging markets:
We're also investing to grow our respiratory business in China, as incomes rise with a preference for high-quality products. Given demographic trends and poor air quality in many regions of China, we believe there is significant market opportunity for our respiratory products in China. Our life science businesses will continue to be positively affected by opportunities in emerging markets, including Africa and India, where we have had recent successes.
And on the perception about China versus the reality for Chart:
I want to point out that sales in China represent less than 10% of our current consolidated sales. Investment decisions on equipment purchases for LNG applications replacing coal are moving forward. However, lower commodity prices, substantially reduced industrial activity, reduced capital investment and continuing government investigations of state-owned enterprises have translated to a more temperate pace than we expected for investment in our equipment. We expect demand to recover as the Chinese government continues to support its pollution control goals, but we do not expect significant improvement in the near term.
Looking ahead
Chart's business may not have bottomed out, but management has done a lot to cut expenses and reduce fixed costs during the past year. And unlike many of the companies caught up in the natural gas craze, Chart remains a solidly profitable company with a good balance sheet and consistent cash flows.
In other words, there's still value, and the stock currently trades at a pretty remarkable discount based on its historical valuations:
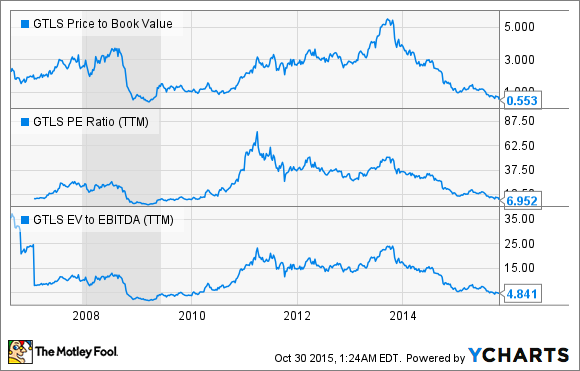
GTLS Price to Book Value data by YCharts.
That's right: Chart's trading essentially at levels the stock hasn't seen since the recession. That's not to say the stock can't go lower -- after all, as I just wrote a few sentences back, business could be even worse next year.
But if business holds even steady -- much less improve a little -- there's an argument to make that Chart could very well be a great value investment.


